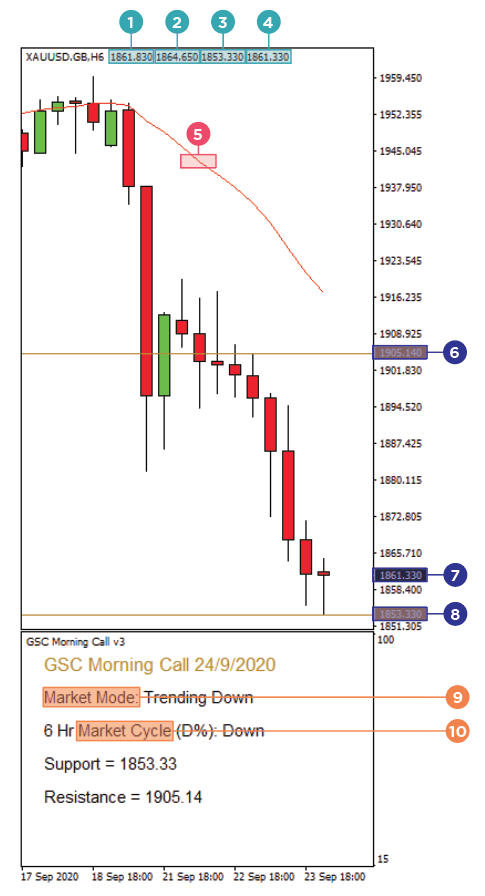
GSC shares Gold price chart to provide daily bite-size technical analysis on Gold market direction in the morning. What can you see from the GSC Morning Call?
Below is a summary of the guidelines to the GSC Morning Call:
- The Open Price for the day
- The High Price as at the time when chart snapshot was captured
- The Low Price as at the time when chart snapshot was captured
- The Close / Current Price as at the time when chart snapshot was captured
- Moving average is a technical analysis tool that smooths out price data by creating a constantly updated average price. On a price chart, a moving average creates a single, flat line that effectively eliminates any variations due to random price fluctuations.
- A Resistance Level is the point on a price chart at which an upward price trajectory is impeded by an overwhelming inclination to sell the asset.
- The Current Price Level
- A Support Level is the point on a price chart at which a downward price trajectory is impeded by an overwhelming inclination to buy the asset.
- Cyclical market are volatile and tend to follow trends in the economy, while non-cyclical market outperform the market during an economic slowdown.
- Market cycle refers to trends or patterns that emerge during different business environments.
Suzane