The Precious Metals market is officially taking a breather in Q3 2026, transitioning from a historic speculative sprint into a necessary downward correction. While short-term selling pressure is currently driving defensive consolidation, our trading floor sees this as a healthy flush-out rather than a structural regime change. Over the coming quarter, expect Gold to test crucial structural support near the $3,900–$4,000 threshold, Silver to chop lower in search of a definitive floor, and Platinum to experience volatile swings toward the $1,500–$1,600 zone as the overarching bull market gradually moves back into historical value areas where institutional buyers are waiting.
This outlook is backed by 15 years of proven market expertise from GoldSilver Central. Specializing in real-time physical bullion trading, collateral loans, and secured storage at the Singapore Freeport, our leadership team delivers institutional-grade intelligence directly to your physical investments. As a proud SBMA member and an Authorised Distributor for the Perth Mint, Royal Mint, and TianXinYang, we cut through the noise so you can navigate this market volatility with confidence. Dive into our individual market breakdowns below to prepare your portfolio for the quarter ahead.
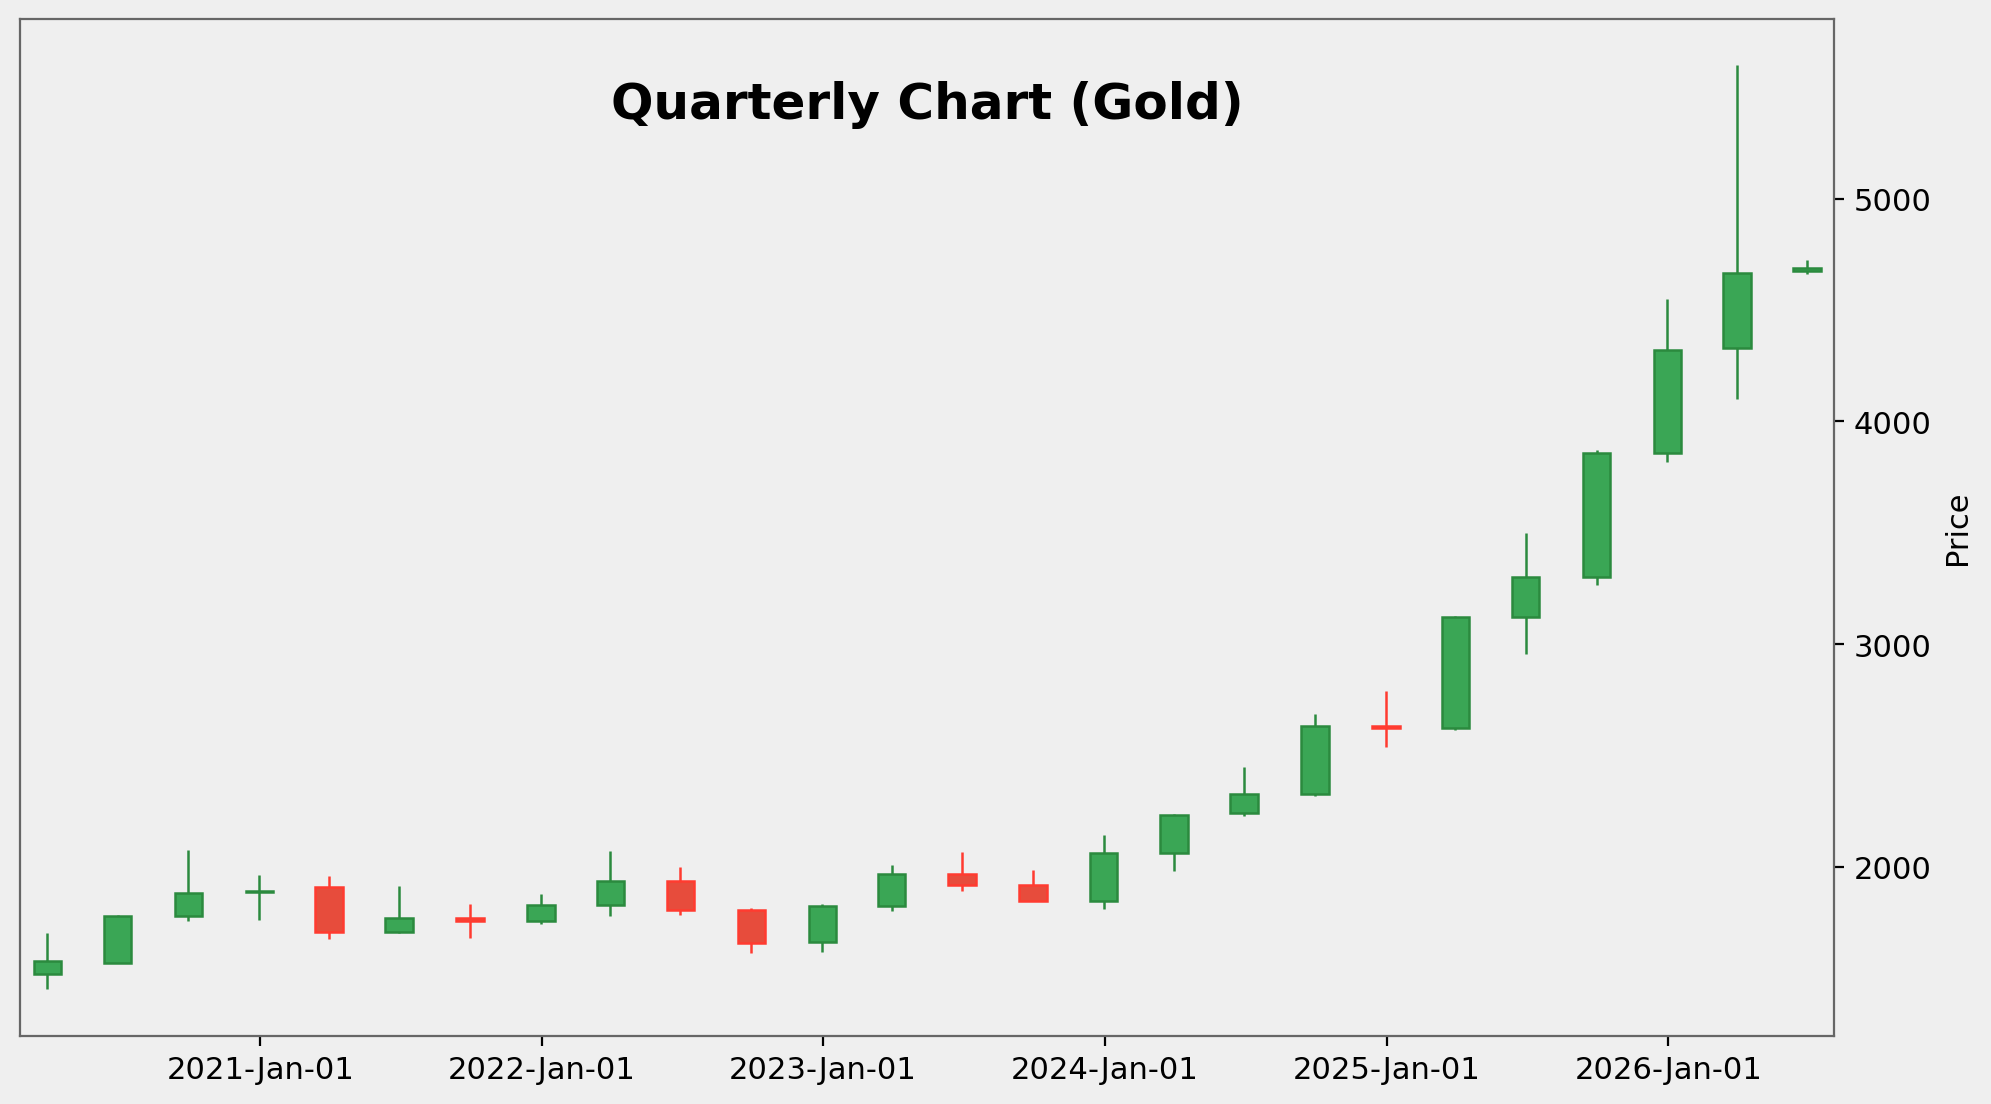
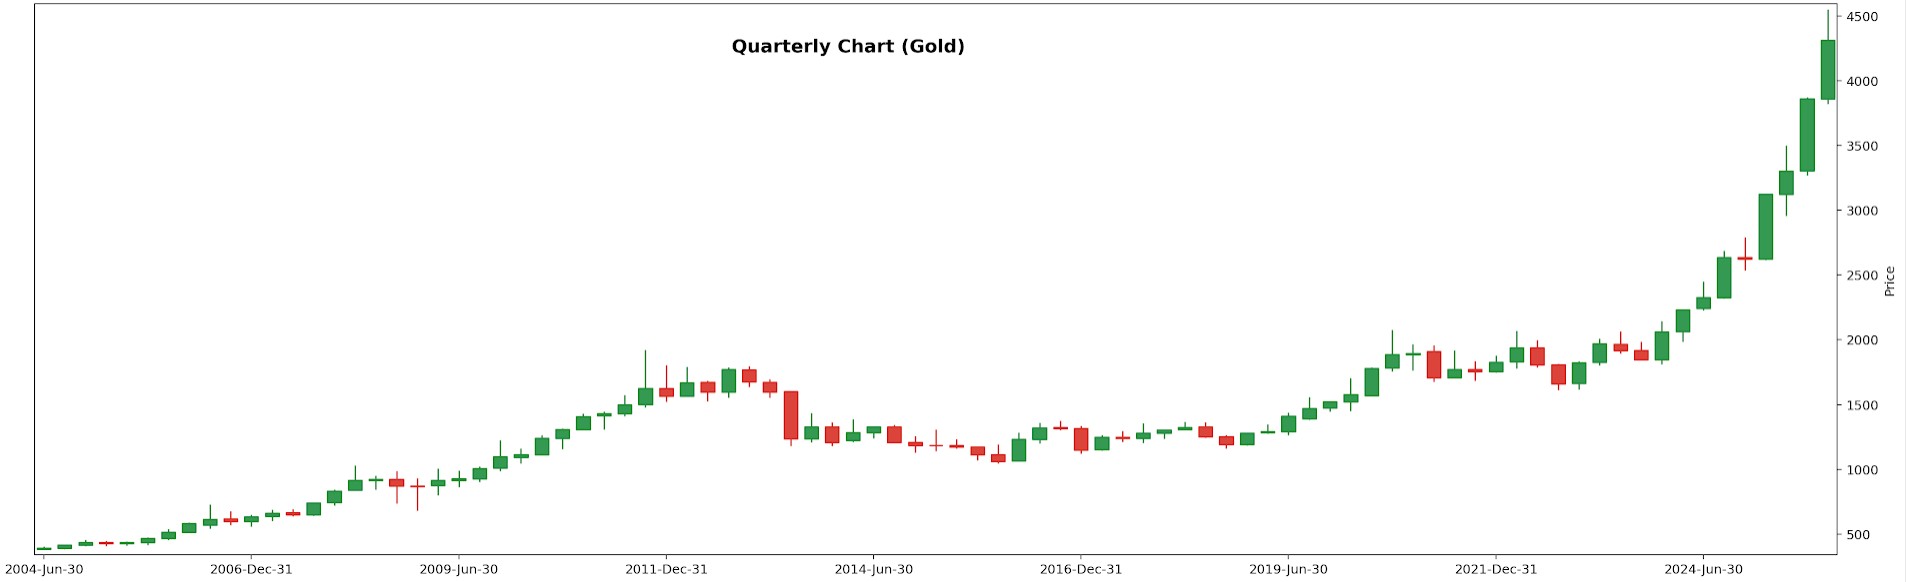
Quarterly Outlook (Q3 2026) for Gold (XAU/USD)
Bulls Defend the Floor, But Bears Control the Momentum
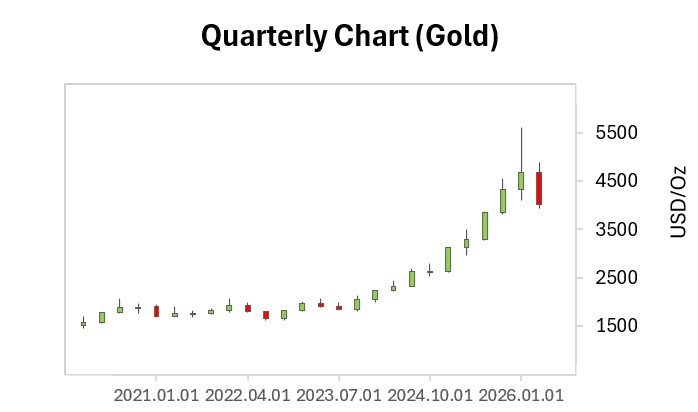
Gold enters Q3 2026 facing its first true tactical test after an unprecedented multi-quarter vertical acceleration that saw prices temporarily breach historical milestones. Following a massive, uninterrupted breakout from its multi-year consolidation base, the market has finally experienced a long-awaited healthy pause.
The most recent quarterly candle shows the first notable red bar in several quarters, indicating a fierce tug-of-war where bears aggressively locked in profits at the highs while long-term bulls stepped in heavily at structural support. This healthy correction represents a necessary transition from an unsustainable “speculative sprint” into a more sustainable, institutional-driven “marathon” pace.
From a structural perspective, our primary quarterly trend indicators suggest that the broader multi-year bull market remains entirely intact. While the short-term momentum has cooled off from its peak overextended territory, the long-term trend strength indicators continue to point upward with a healthy positive slope. This indicates that the current price softening is not a structural regime change or a market top, but rather a classic mid-cycle breathing room.
All in, we expect prices to face downward pressure and defensive consolidation throughout Q3 as short-term momentum gauges continue to reset from overextended peaks. Because the quarterly cyclical indicators have rolled down from overbought extremes, the market has successfully flushed out weak-handed speculative leverage.
This sets a much cleaner stage for the next wave of institutional accumulation, where deeper downside dips are expected to be aggressively bought into by long-horizon investors, keeping the dominant secular uptrend firmly in control.
Quarterly Risk Notes
While long-term trend indicators show the structural bull market is wounded but intact, short-term cyclical indicators have plunged into deeply depressed territories. If the nearest quarterly structural support fails to spark a convincing institutional bounce, it would signal that the market is transitioning from a temporary mid-cycle pause into a more prolonged macro consolidation.
Key Technical Levels
Support 1: ~$3,900 – $4,000 (nearest quarterly structural support)
Support 2: ~$3,550 – $3,600 (major prior consolidation area)
Resistance 1: ~$4,500 – $4,600 (psychological milestone / recent breakout zone)
Resistance 2: ~$5,300 – $5,500 (macro extension / next probable target region)
Macro Catalyst Themes for Q3 2026
- Real Yield Opportunity Costs: Re-emergence of gold’s inverse relationship with US real yields as the Fed maintains a higher-for-longer policy trajectory.
- Shifting Rate Expectations: Volatility driven by changing expectations surrounding global central bank rate cycles and liquidity expansion.
- US Dollar Index (DXY) Resilience: A strong greenback challenging gold’s status as a safe-haven alternative.
- Central Bank Buying Elasticity: Continued, yet structurally cooled, institutional accumulation compared to the historic rush of recent years.
- Sovereign Debt Risks: Looming global deficits and long-term fiscal expansion providing a persistent structural floor for the macro super-cycle.
—————————————————
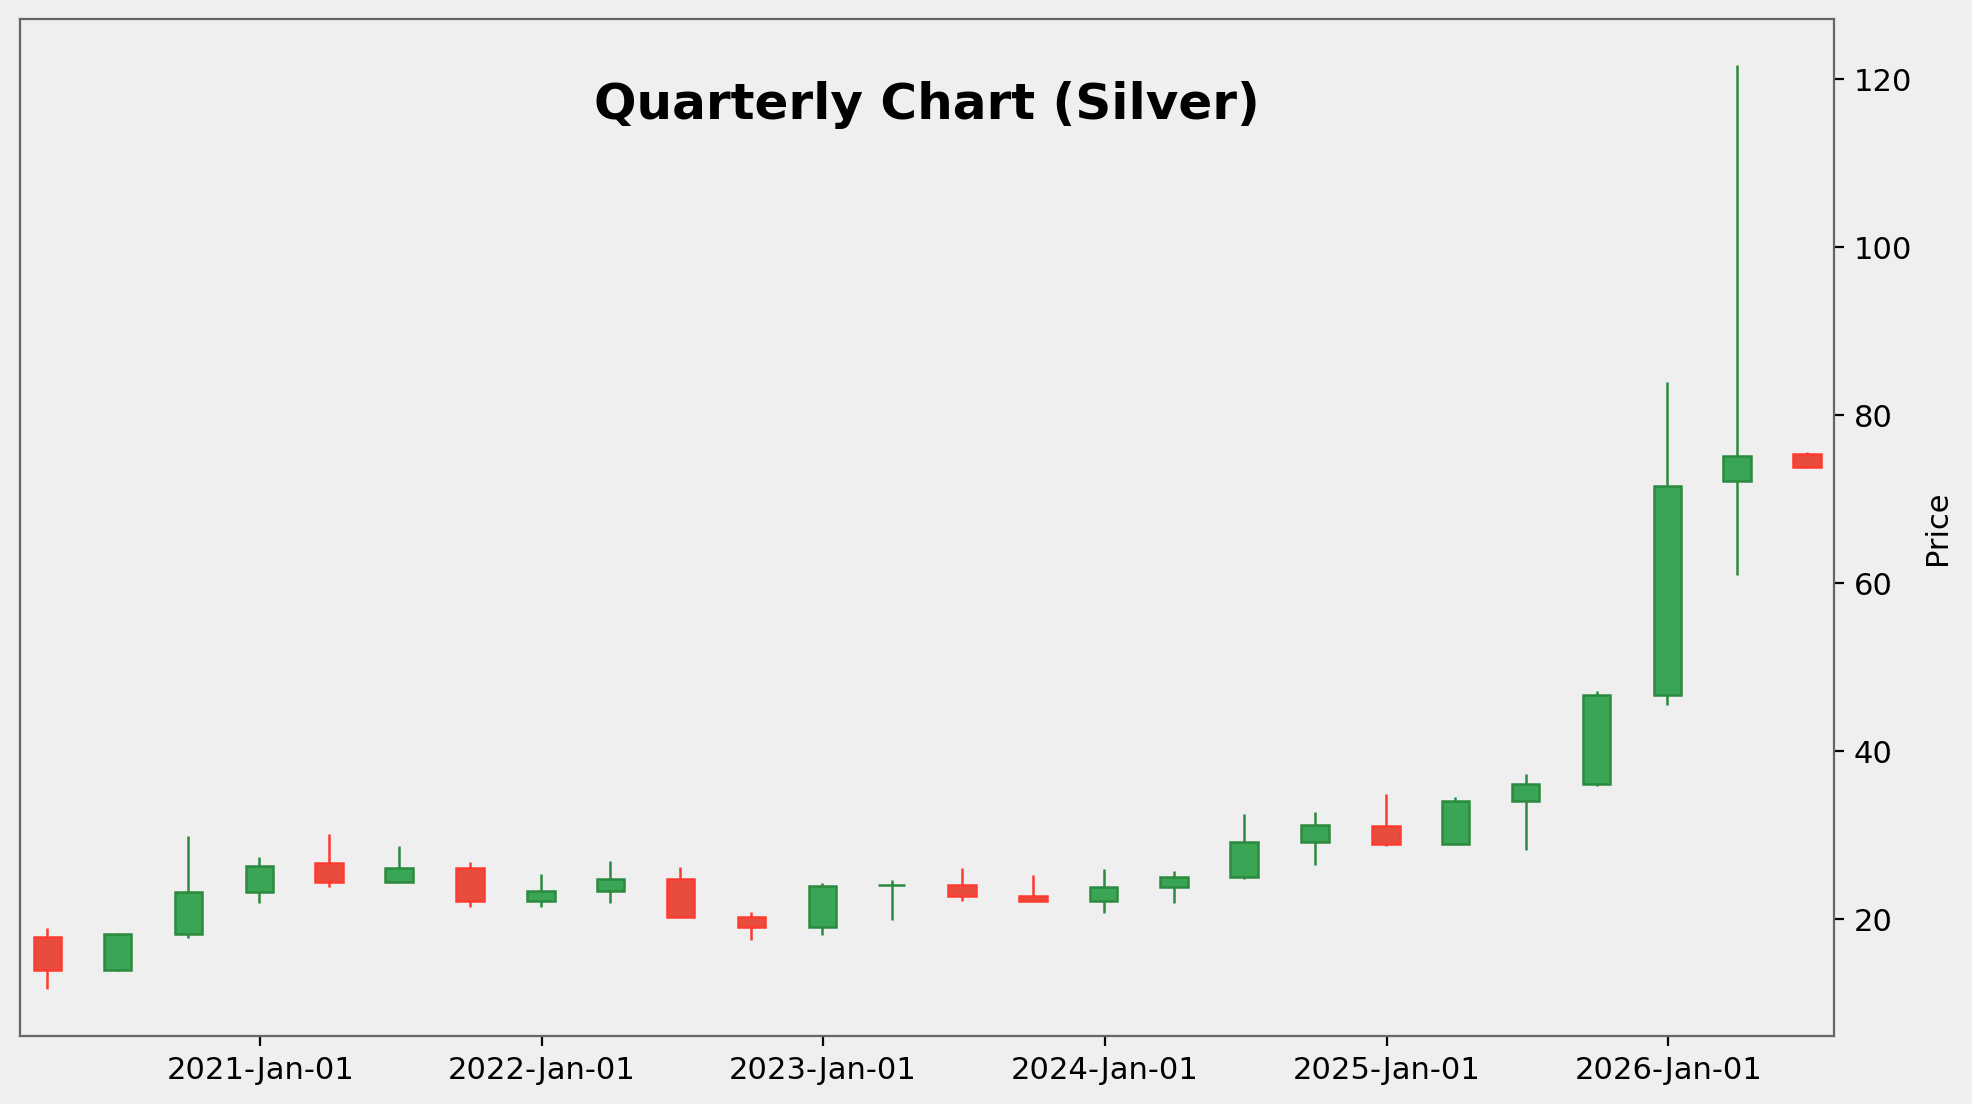
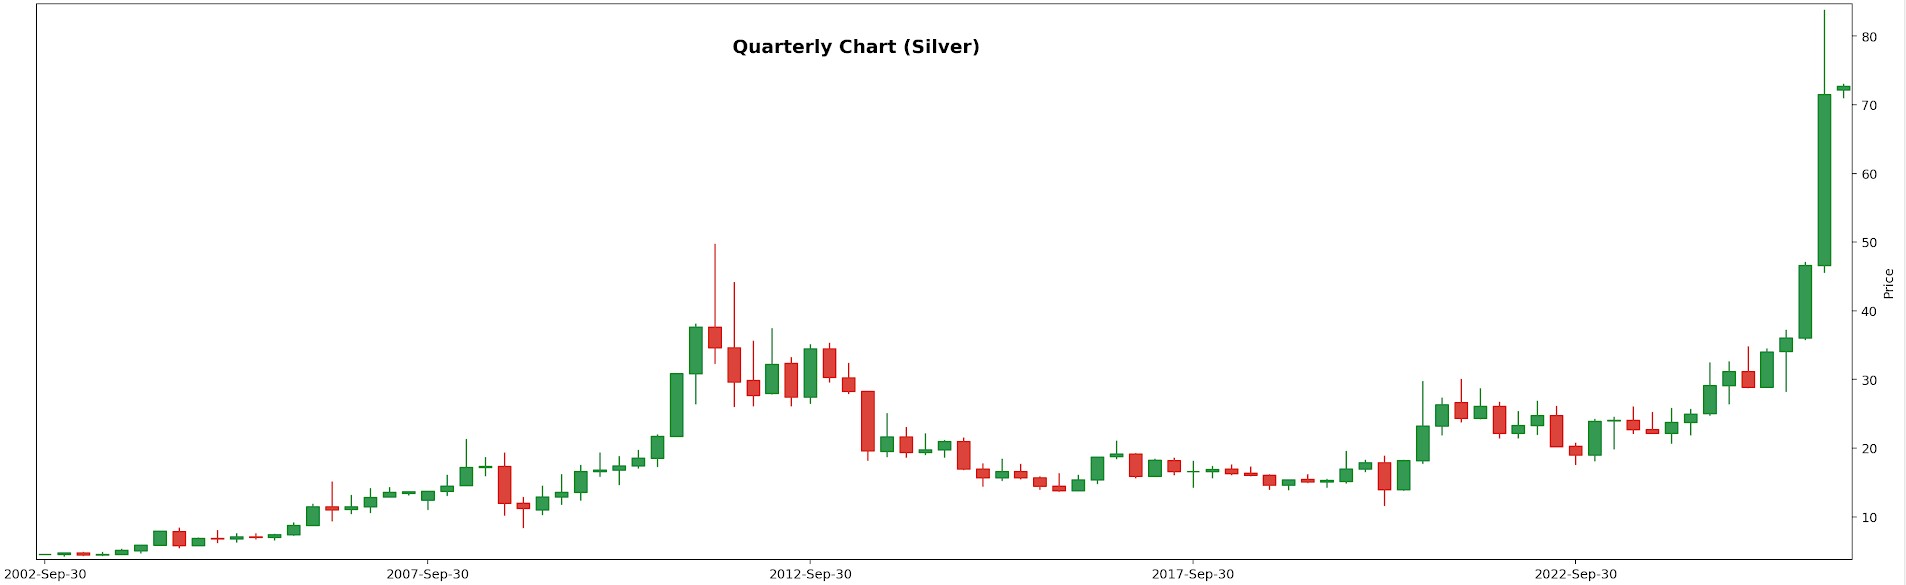
Quarter 2 Outlook for Silver (XAG/USD)
Bears Grip the Near-Term Momentum as Silver’s Historic Spike Cools
Silver enters Q3 2026 during a sharp, high-velocity correction after an unprecedented vertical surge that saw prices temporarily rocket to historic vertical milestones above $120. Following a multi-year slumber, the industrial precious metal experienced an explosive breakout that has finally run into a wall of aggressive profit-taking. The most recent quarterly candle is a decisive red bar, signalling that the bears have seized control of the immediate playing field, pushing the price back down to earth as speculative foam is violently flushed from the market.
From a technical standpoint, our primary quarterly trend indicators reveal a fascinating divergence between long-term strength and short-term exhaustion. While near-term cyclical indicators are plunging sharply downward, showing that selling momentum remains completely dominant for now, our long-term trend strength indicators continue to rise with a steep positive slope. This indicates that the overarching, multi-year secular bull market has not suffered a structural regime change; rather, the market is undergoing a brutal but necessary cooling-off phase to digest its massive overextension.
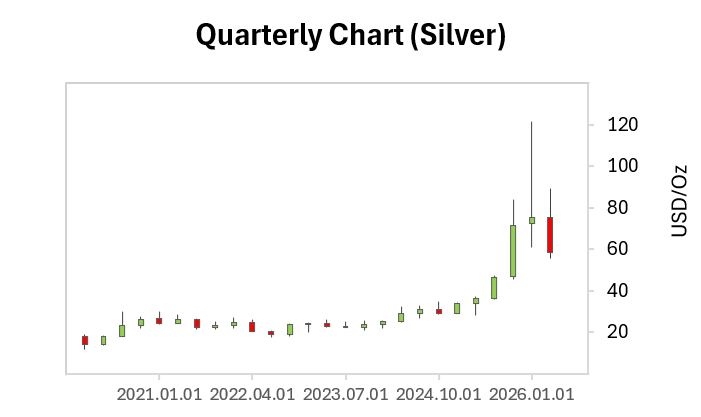
All in, we expect silver to remain in a decisive downward correction this quarter. Because short-term momentum gauges are still falling, the market has not yet confirmed a definitive technical floor, meaning further chop and downside testing could persist in the weeks ahead. However, because the structural core of the trend remains intact, these deep pullbacks are gradually moving silver back into areas of strong long-term value, where institutional accumulation is expected to step in to defend the broader macro advance.
Quarterly Risk Notes
The primary risk for Q3 2026 is a deeper-than-expected washouts driven by cascading speculative liquidations. Because silver is highly volatile, the sharp downturn in short-term cyclical gauges can cause prices to overcorrect on the downside even while the long-term trend remains healthy. A true structural breakdown would require a total collapse of our macro trend-strength indicators below historical baseline levels, but near-term volatility will remain elevated until the current selling velocity exhausts itself.
Key Technical Levels
Support 1: ~$55 – $60 (nearest quarterly structural support)
Support 2: ~$35 – $40 (major prior consolidation area and ultimate macro safety net)
Resistance 1: ~$80 – $90 (psychological milestone / immediate overhead supply zone)
Resistance 2: ~$110 – $120 (macro extension / previous historical peak region)
Catalyst Events to Watch:
- Real Yield Opportunity Costs: Re-emergence of silver’s inverse relationship with US real yields as the Fed maintains a higher-for-longer policy trajectory.
- Shifting Rate Expectations: Volatility driven by changing expectations surrounding global central bank rate cycles and liquidity expansion.
- US Dollar Index (DXY) Resilience: A strong greenback challenging silver’s safe-haven appeal and putting pressure on dollar-denominated commodities.
- Industrial Demand Volatility: Shifting global manufacturing data, electronics manufacturing, and solar sector growth metrics acting as a heavy swing factor for silver’s industrial side.
—————————————————
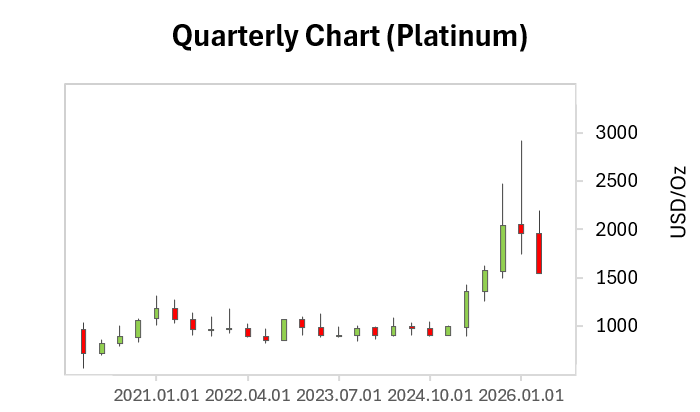
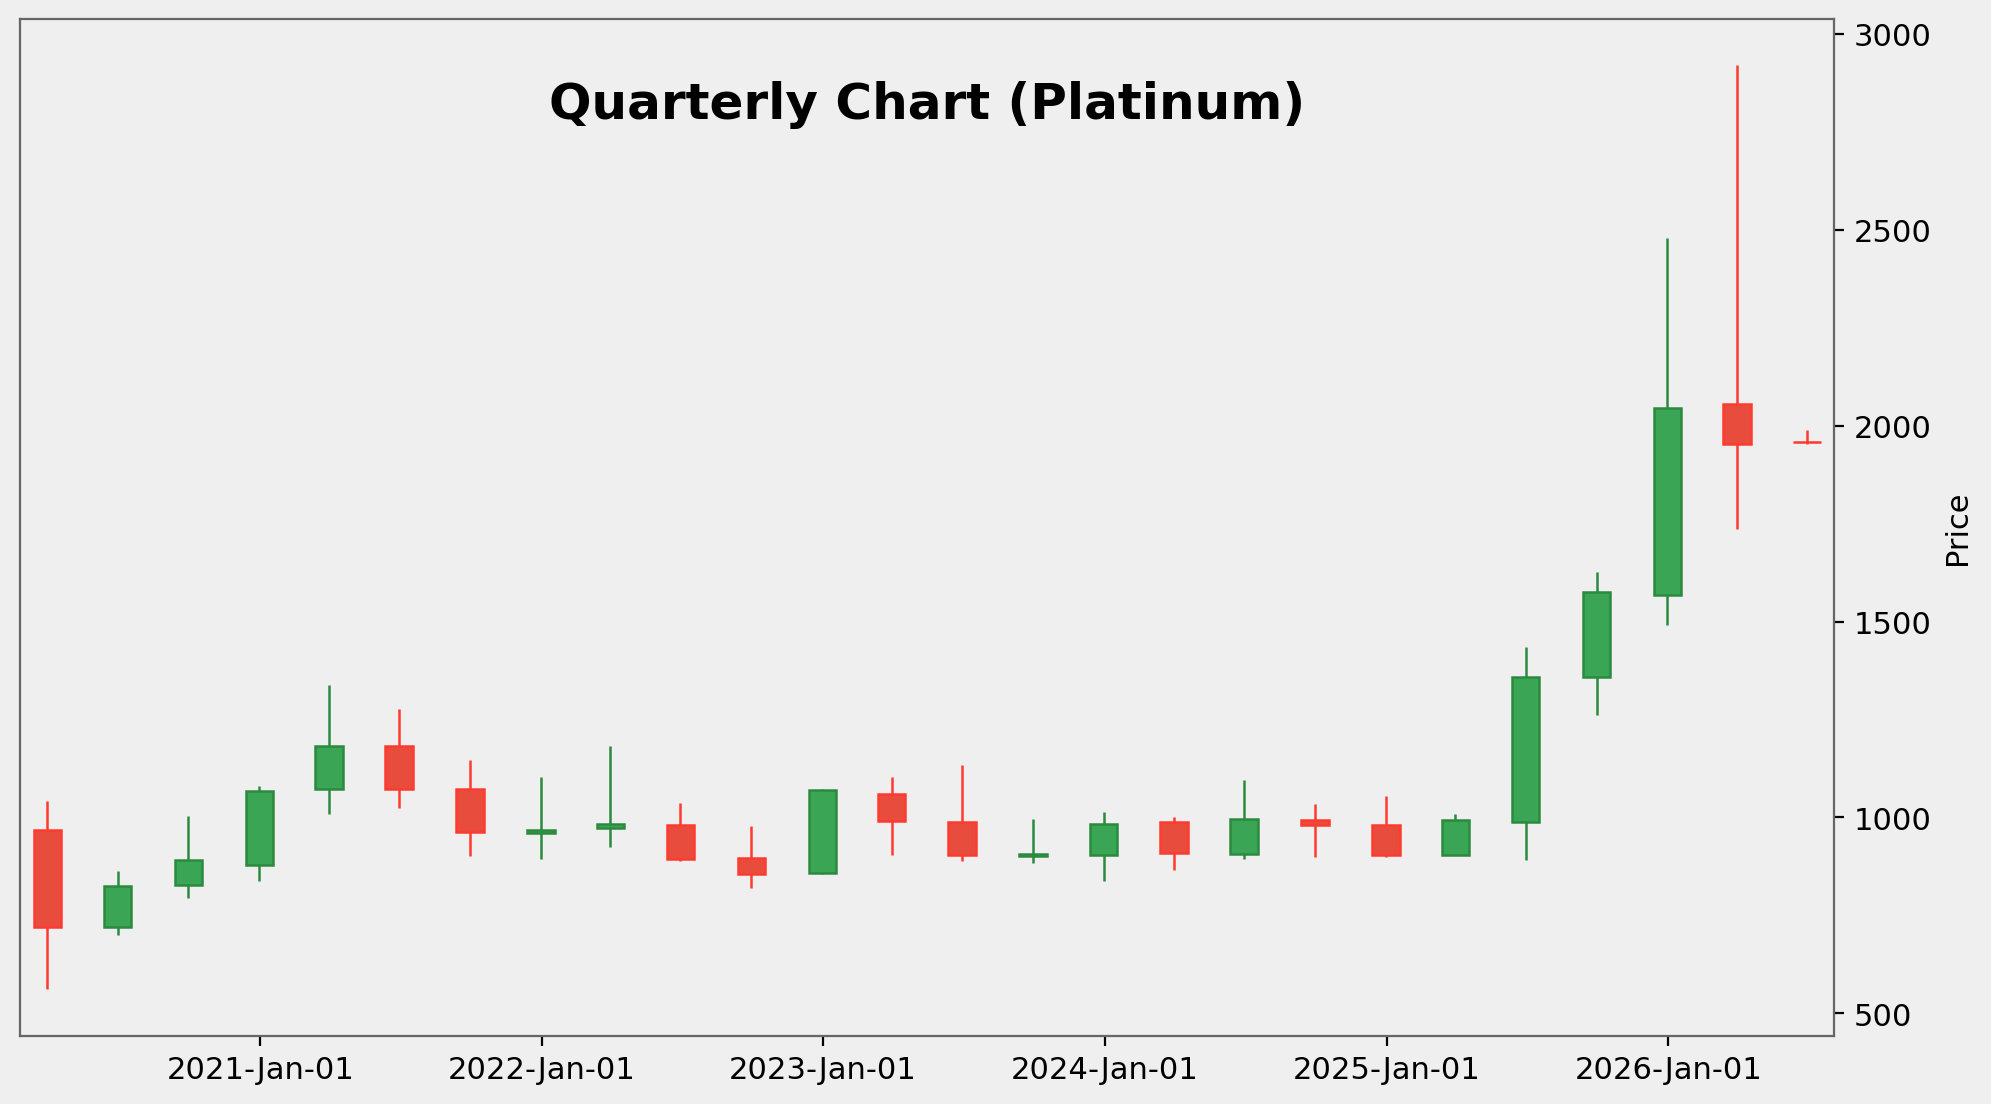
Quarterly Outlook (Q3 2026) for Platinum (XPT/USD)
A Gritty Momentum Reset Test as Platinum Digests Its Historic Spike
Platinum enters Q3 2026 undergoing a sharp, high-volatility correction after an unprecedented multi-quarter vertical acceleration that saw prices violently breach multi-year ceilings to strike historic highs near $3,000. Following a decade of structural stagnation, the market experienced an extraordinary breakout that has finally triggered a wave of aggressive profit-taking. The most recent quarterly candle shows a prominent red corrective bar, indicating that the bears have successfully wrestled back near-term control.
From a structural standpoint, the underlying price layout reveals a stark divergence between immediate selling pressure and the macro trend. While near-term cyclical indicators are pointing sharply downward, confirming that downward momentum remains fully dominant for the time being, the long-term trend strength indicators continue to head higher with an aggressive positive slope.
This indicates that the broader, macro secular breakout remains structurally valid; the market is simply experiencing a violent but technically healthy cooling-off phase required to work off deeply overextended conditions.
All in, we anticipate a clear downward reset for platinum in Q3 2026. Because short-term momentum gauges are still cascading downward, the market has yet to establish a definitive technical bottom, implying that choppy consolidation and further downside testing could easily carry over into the coming quarter.
However, as the structural uptrend remains intact, this steep retracement is rapidly bringing platinum back toward major historical support layers, where long-horizon institutional demand is expected to emerge to stabilize the broader bull cycle.
Quarterly Risk Notes
The primary risk heading into Q3 2026 centers on localized liquidation as stop-losses trigger within platinum’s characteristically thin liquidity conditions. Because short-term cyclical gauges have rolled over aggressively from historical extremes, prices can easily overcorrect despite a healthy secular backdrop. While a true structural trend reversal would require long-term trend strength to flatten or cross back down, immediate price swings will remain highly erratic until the ongoing selling velocity exhausts itself.
Key Technical Levels
Support 1: ~$1,500 – $1,600 (nearest quarterly structural support)
Support 2: ~$1,100 – $1,200 (ultimate macro safety net)
Resistance 1: ~$2,100 – $2,200 (psychological milestone)
Resistance 2: ~$2,700 – $2,900 (macro extension / previous historical peak region)
Catalyst Events to Watch:
- Automotive and Industrial Demand Revisions: Shifting global manufacturing trends, particularly changes in hydrogen technology infrastructure and automotive catalyst demand, acting as a crucial fundamental swing factor.
- Real Yield Opportunity Costs: Re-emergence of platinum’s inverse relationship with US real yields as the Federal Reserve maintains a higher-for-longer monetary policy trajectory.
- Real Yield Opportunity Costs: Re-emergence of platinum’s inverse relationship with US real yields as the Federal Reserve maintains a higher-for-longer monetary policy trajectory.
- Supply-Side Disruptions and Mine Economics: Operational and power-grid constraints within primary mining jurisdictions (such as South Africa) providing a structural supply floor beneath the market.
—————————————————
For more Bullion Insights, join GoldSilver Central’s Telegram channel or subscribe to our Bullion Insights Newsletter.
After a historic run, the precious metals market is showing early signs of late stage trend fatigue. Our Q2 2026 Insight Report breaks down the critical technical and macroeconomic outlooks for Gold, Silver, and Platinum. With our quantitative models pointing toward downward biased consolidation, this analysis provides the key support levels and upcoming FOMC catalysts you need to adjust your positioning and stay ahead of the curve.
This report is backed by 15 years of proven market expertise. GoldSilver Central specializes in real time physical bullion trading, collateral loans, and secured storage at the Singapore Freeport. As a proud SBMA member and an Authorised Distributor for Perth Mint, Royal Mint, and TianXinYang, our leadership team brings institutional grade intelligence to your physical bullion investments. Read on to prepare your portfolio for the quarter ahead.
Quarter 2 Outlook for Gold (XAU/USD)
Downward-biased consolidation
On the quarterly timeframe, while the broader structure appears bullish following the sharp acceleration in recent quarters which saw Gold trading above the US$4,000–$5,000 region, our quantitative models are showing early signs of fatigue as the bullish structure is maturing being in its late-stage trend. Alongside the loss of immediate upside acceleration, the market may begin transitioning into a consolidation setup. All in, our model signals a bearish divergence with down cycle likely for the quarter ahead.
Key Technical Levels
Support 1: ~$4,300–$4,500 (recent breakout / consolidation zone)
Support 2: ~$3,800–$4,000 (major structural support)
Resistance 1: ~$5,000–$5,200 (psychological / recent highs)
Resistance 2: ~$5,500+ (extension zone if trend continues)
Catalyst Events to Watch:
(i) April: Early-quarter USD trajectory & Treasury yield positioning
(ii) May: Inflation data cycle (CPI / Core CPI, PCE)
(iii) June (FOMC Focus): Fed policy decision, dot plot revisions & forward guidance
(iv) Throughout Quarter: Labour market data (NFP, Jobless Claims) & cross-asset volatility
(v) Quarter-End (June): Institutional rebalancing, CTA positioning & portfolio adjustments
Gold remains particularly sensitive to USD direction and real yields, which continue to act as the primary macro transmission channels, while shifts in institutional positioning and macro expectations may amplify price movements during periods of consolidation or trend transition.
—————————————————
Quarter 2 Outlook for Silver (XAG/USD)
Down Cycle Likely
While the bullish structure for Silver appears intact following the vertical expansion in recent quarters which saw Silver touching the US$121 region, there are early signs of fatigue as it reflects a late-stage trend acceleration, typical of a breakout phase after prolonged consolidation. Our quantitative models signal a bearish divergence, suggesting a strong likelihood of a down cycle for the quarter ahead. Given Silver’s high beta nature, Silver may exhibit larger swings and deeper corrections than Gold during consolidation phases.
Key Technical Levels
Support 1: ~$65–$70 (recent breakout / consolidation zone)
Support 2: ~$55–$60 (secondary structural support)
Resistance 1: ~$80–$90 (near-term extension zone)
Resistance 2: ~$100+ (psychological extension if trend continues)
Catalyst Events to Watch:
April: Early-quarter USD direction & Treasury yield positioning
May: Inflation data cycle (CPI / Core CPI, PCE) & macro repricing dynamics
June (FOMC Focus): Fed policy decision, dot plot revisions & forward guidance
Throughout Quarter: Global growth expectations, industrial demand indicators & cross-asset volatility
Quarter-End (June): Institutional rebalancing, CTA flows & positioning adjustments
Silver remains highly sensitive to USD direction, real yields, and global growth expectations, which act as the primary macro drivers, often amplifying both upside and downside volatility relative to Gold.
—————————————————
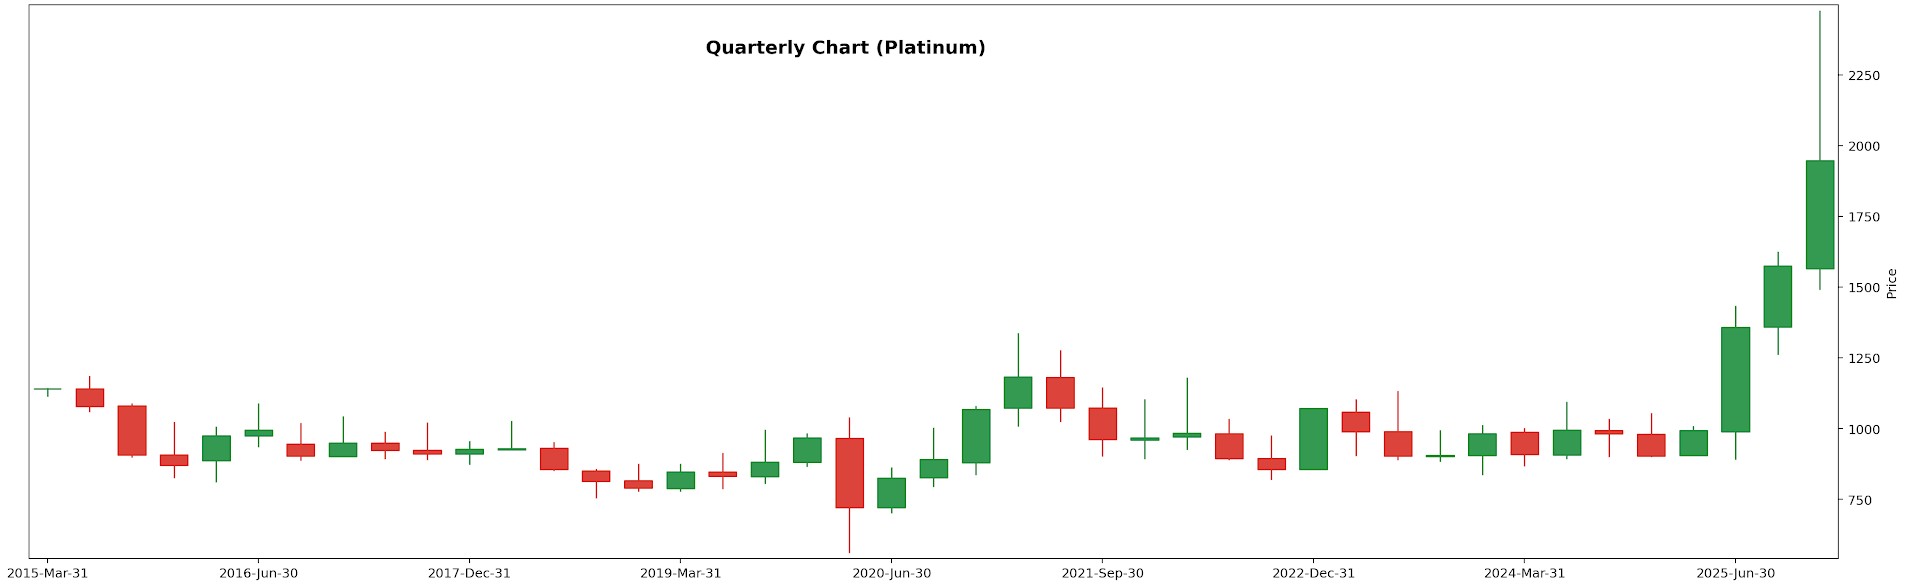
Quarter 2 Outlook for Platinum (XPT/USD)
Downward Bias
While the bullish structure for Platinum remains intact following the steady breakout from its multi-year base in recent quarters, a rejection at the high in the region of US$2,920 saw Platinum transitioning from its prior parabolic expansion into a maturing phase as it digested gains. On the quarterly time frame, our quantitative models point to emerging divergence, indicating a higher probability of a downward cycle for the quarter ahead. A breakdown below $1,700 may signal deeper correction risk towards ~$1,600–$1,650.
Key Technical Levels
Support 1: ~$1,750–$1,800 (initial breakout support)
Support 2: ~$1,600–$1,650 (strong structural base)
Resistance 1: ~$2,000–$2,100 (psychological + supply zone)
Resistance 2: ~$2,300–$2,500 (extension zone)
Catalyst Events to Watch:
(i) Apr 1 (Wed): Early-quarter USD flows & Treasury yield positioning
(ii) Apr–May: Inflation expectations / macro repricing dynamics
(iii) May (FOMC window): Fed commentary / rate-path expectations
(iv) May–Jun: Global growth indicators (PMIs, China data) / industrial demand signals
(v) Jun (Quarter-end): Risk sentiment into quarter close/positioning adjustments
Platinum remains sensitive to USD direction, real yields, and global industrial demand expectations, particularly developments in the automotive sector, which will continue to influence short-term direction and medium-term trend stability.
—————————————————
For more Bullion Insights, join GoldSilver Central’s Telegram channel or subscribe to our Bullion Insights Newsletter.

Gold, Silver, Platinum Quarterly Insights: Q4 2025 Review & Q1 2026 Outlook
As we enter a new year of unprecedented market dynamics, investors are increasingly looking for stability and growth in the precious metals sector. At GoldSilver Central, we provide deep-dive analytics into the gold, silver, and platinum markets to help you stay ahead of the curve. Our Q4 2025 review and 2026 outlook highlight a historic “super-cycle” phase across all three major metals.
Quarterly Outlook: Q4 2025 (Quarter ending December 31, 2025) for Gold (XAU/USD)
Strongest multi-quarter bull phase since 2005–2011
Gold continues to exhibit one of the strongest long-term breakouts in its modern history, with quarterly candles accelerating vertically after clearing the multi-year consolidation zone around $2,050–$2,150 toward fresh all-time highs above $4,000–$4,300. Price is now in pure price-discovery mode above the prior multi-year highs.
The last several quarters have shown strong green candles, higher highs and higher lows, zero meaningful pullback on quarterly scale, with the most recent quarterly bar showing a decisive continuation impulse, reaffirming gold’s dominant secular uptrend that has been in place since 2018. This quarterly breakout is uniquely large and steep, suggesting a broad macro repricing of gold as a reserve asset, not a short-term speculative blowoff, alongside institutional accumulation and long-horizon trend conviction.
From our quarterly trend indicators, gold now mirrors early-stage 2009–2010 acceleration, but with a steeper slope, suggesting we are entering the middle phase of a major bull market, not the end. Consistent with strong long-term trend strength, our quarterly cyclical indicators are aligned in peak-trend configuration to support trend continuation, suggesting no near-term exhaustion on the quarterly timeframe.
All in, gold enters Q1 2026 with an exceptionally strong bullish bias with dips likely to be shallow and aggressively accumulated. The structure points toward an ongoing super-cycle phase driven by falling real yields, global liquidity rotation, and persistent geopolitical risk premiums. As long as gold remains above $3,900, the secular uptrend remains dominant with open-air upside toward $4,500–$5,000 in the coming quarters.
Quarterly Risk Notes For Gold
Quarterly charts rarely give early reversal signals — weakness would first appear in monthly, not quarterly. Only a sharp breakdown in our trend indicators or a collapse in our cyclical indicators would imply change in structural regime.
Key Technical Levels:
Support 1: ~$3,900 (nearest quarterly structural support)
Support 2: ~$3,550–$3,600 (major prior consolidation area)
Resistance 1: ~$4,500 (psychological milestone)
Resistance 2: ~$4,800–$5,000 (macro extension / next probable target region)
Macro Catalyst Themes for Q1 2026
• Real yields and Treasury market volatility
• Fed rate-cut cycle expectations and liquidity expansion
• USD index (DXY) direction
• Geopolitical risk (Middle East / Asia tensions)
• Central bank gold purchases (continued accumulation trend)
• Global recession risk — historically bullish for gold
Quarterly Outlook: Q4 2025 (Quarter ending December 31, 2025) for Silver (XAG/USD):
A super-trend phase with open upside potential extending into 2026
Silver has entered a historic acceleration phase on the quarterly timeframe, breaking decisively above all prior multi-year resistance and surging into new all-time high territory. This quarter’s candle is a powerful bullish expansion bar, reflecting a structural regime shift from long-term consolidation into a full momentum breakout – one of its strongest quarterly breakouts in decades.
The breakout candle is large, directional, and supported by tight clustering of prior quarters — a textbook ignition pattern. The magnitude and velocity of the move clearly indicate institutional repositioning, macro flows favoring precious metals, and tightening physical market dynamics.
The quarterly structure now aligns with a parabolic continuation pattern, supported by synchronized breakouts in gold and platinum. The slope of the quarterly trend has steepened significantly, confirming acceleration rather than exhaustion. With strong confirmation across trend and cyclical indicators, silver appears to be in the early-to-mid stages of a large multi-quarter uptrend, signifying trend lock-in — a hallmark of super-cycles. No overhead resistance exists; price is in full price discovery mode.
As long as silver holds above $60, the bullish super-cycle structure remains firmly intact, with open upside into 2026 and potential psychological targets at $85–100, with volatility expanding but bias clearly upward.
Key Technical Levels For Silver:
Support 1: ~$60 (first major retest zone / breakout base)
Support 2: ~$50 (prior multi-year ceiling)
Resistance 1: None — price discovery
Resistance 2: N/A — higher targets develop as structure forms
Potential future resistance projections (if trend continues):
$85–90 (psychological round zone)
$100 (major psychological and historical projection target)
Note: Quarterly levels are wide due to large candle height
Macro Catalyst Themes for Q1 2026
(i) Structural Demand Drivers
Solar PV and green-energy expansion
Battery and electronics demand growth
Industrial restocking cycles
(ii) Macro & Monetary Drivers
Declining real yields
USD weakening episodes
Monetary easing cycles from central banks
Rising geopolitical hedging demand
(iii) Supply Factors
Persistent mine under-investment
Fragile Mexican and Peruvian output
Tightening above-ground stocks
Quarterly Outlook: Q4 2025 (Quarter ending December 31, 2025) for Platinum (XPT/USD):
$1,700 Key Support
Platinum has confirmed a long-awaited quarterly breakout, transitioning from a multi-year accumulation range $1,100–$1,200 into a strong bullish expansion phase, accelerating sharply into the $1,900–$2,000+ region. The latest quarterly candle is a large bullish expansion bar, confirming a regime shift from prolonged range-bound behavior into a sustained trending phase.
This move represents the strongest quarterly upside impulse in platinum in more than a decade. Price has entered a higher structural regime, and is now entering price-discovery territory, with limited historical overhead supply.
Our trend indicators showcase strengthening trend energy rather than maturity. This is characteristic of early-to-mid trend development, not a terminal move. Meanwhile, quarterly cyclical behavior mirrors the early breakout phases seen in prior commodity super-cycles rather than late-stage exhaustion. All in, indicators are supportive of further upside across coming quarters.
While volatility may expand as the trend develops, the quarterly structure favors continued upside into 2026 as long as platinum holds above $1,700. From a cycle perspective, platinum appears to be earlier in its trend than gold and silver, suggesting relative upside potential over the coming quarters if industrial demand, auto-catalyst usage, and supply constraints remain supportive.
Key Technical Levels For Platinum:
Support 1: ~$1,700 (first major breakout retest zone)
Support 2: ~$1,400–$1,500 (upper boundary of prior base)
Resistance 1: ~$2,300 (measured breakout extension)
Resistance 2: ~$2,600–$2,800 (long-term projection zone if trend persists)
Macro Catalyst Themes for Q1 2026
Auto-sector demand recovery and emissions-standard tightening
Hydrogen and fuel-cell investment trends
South African mining supply stability (key structural risk)
Precious-metals portfolio rotation alongside gold and silver
Macro liquidity cycles and real-yield dynamics
Contact GoldSilver Central via email ([email protected]) or WhatsApp (+65 8893 9255) to receive actionable analysis on gold, silver, and platinum that empowers your trading decisions. Let us help you navigate the complexities of trending and cyclical markets with confidence.


After climbing for four consecutive quarters, Gold prices reached a new all-time high in October 2024, peaking at US$2,790/oz. However, the momentum faltered in Q4, with Gold giving back all its quarterly gains to close the quarter marginally lower by US$9.79/oz, or 0.37%. As we transition into Q1 2025, our proprietary system signals a shift in market dynamics, with Gold bears attempting to wrest control from the bulls. This suggests a potential further pullback in prices during the quarter. Bears are eyeing the US$2,537/oz level—the low from Q4 2024—as a key test of demand strength. However, this pullback is expected to be brief and temporary, as the long-term cyclical uptrend for Gold remains intact.
Similarly, Silver prices saw a marked decline in Q4, dropping 7.21%, or US$2.24/oz, after four consecutive quarterly increases. Looking ahead to Q1 2025, our analysis indicates further pressure on Silver, with bears targeting the US$26.45/oz level, which represents the low from H2 2024. While early signs suggest the current bull trend for Silver may be stalling, there is no definitive evidence of a shift to a bear market yet.
Our system suggests that if the broader precious metals market continues its downtrend, Silver’s downside risk may surpass Gold’s in percentage terms this quarter.
Platinum prices also retreated in Q4, declining by US$78.36/oz, or 7.99%. Despite this, Platinum has stayed within its well-established trading range of US$850/oz to US$1,100/oz, a band that has persisted since Q3 2021. As we enter Q1 2025, our system forecasts continued range-bound trading for Platinum, albeit with a downside bias. Bears are likely to test the US$850/oz level, the lower boundary of this range.
For additional insights or inquiries regarding our Q1 2025 outlook for the precious metals market, please don’t hesitate to reach out. We are always here to support you and wish you a successful trading quarter!


")
")


Precious metal prices, like Gold, Silver, and Platinum, often oscillate between trending and cyclical phases, creating distinct opportunities and challenges for traders. Understanding these dynamics is crucial for aligning your strategy with the prevailing market environment. Here’s an in-depth look at how these phases operate and how traders can use them to their advantage.
Trending Phases
In trending phases, precious metal prices move in a clear and sustained direction—upward in bullish trends or downward in bearish trends. These movements are influenced by economic details, including:
- Interest Rates: Changes in central bank policies, such as rate hikes or cuts, directly impact precious metals, which are non-yielding assets.
- Macroeconomic Data: Inflation reports, employment data and GDP growth often set the tone for the metals market.
- Geopolitical Events: Global uncertainty, like wars or trade disputes, tends to favor safe-haven assets like gold.
While economic factors influence market sentiment, price movement ultimately depends on the underlying buying or selling action. These phases vary in sustainability and depending on the horizon of the trade, different metrics should be used to derive the outlook.
Cyclical Phases
Cyclical, or range-bound, phases occur when precious metal prices fluctuate between well-defined support and resistance levels. These phases often suggest a balance between buyers and sellers, leading to indecision in the market. Key characteristics of cyclical markets include:
- Repetitive Movements: Prices oscillate within a specific range, often without a clear direction.
- Market Consolidation: These periods are often precursors to a breakout in either direction.
- Neutral Bias: There is no strong preference for upward or downward movements, making directional strategies less effective.
Trading a trending strategy in a cyclical market can lead to losses, as the lack of directional momentum results in false signals. Instead, range-bound strategies are better suited for these phases.
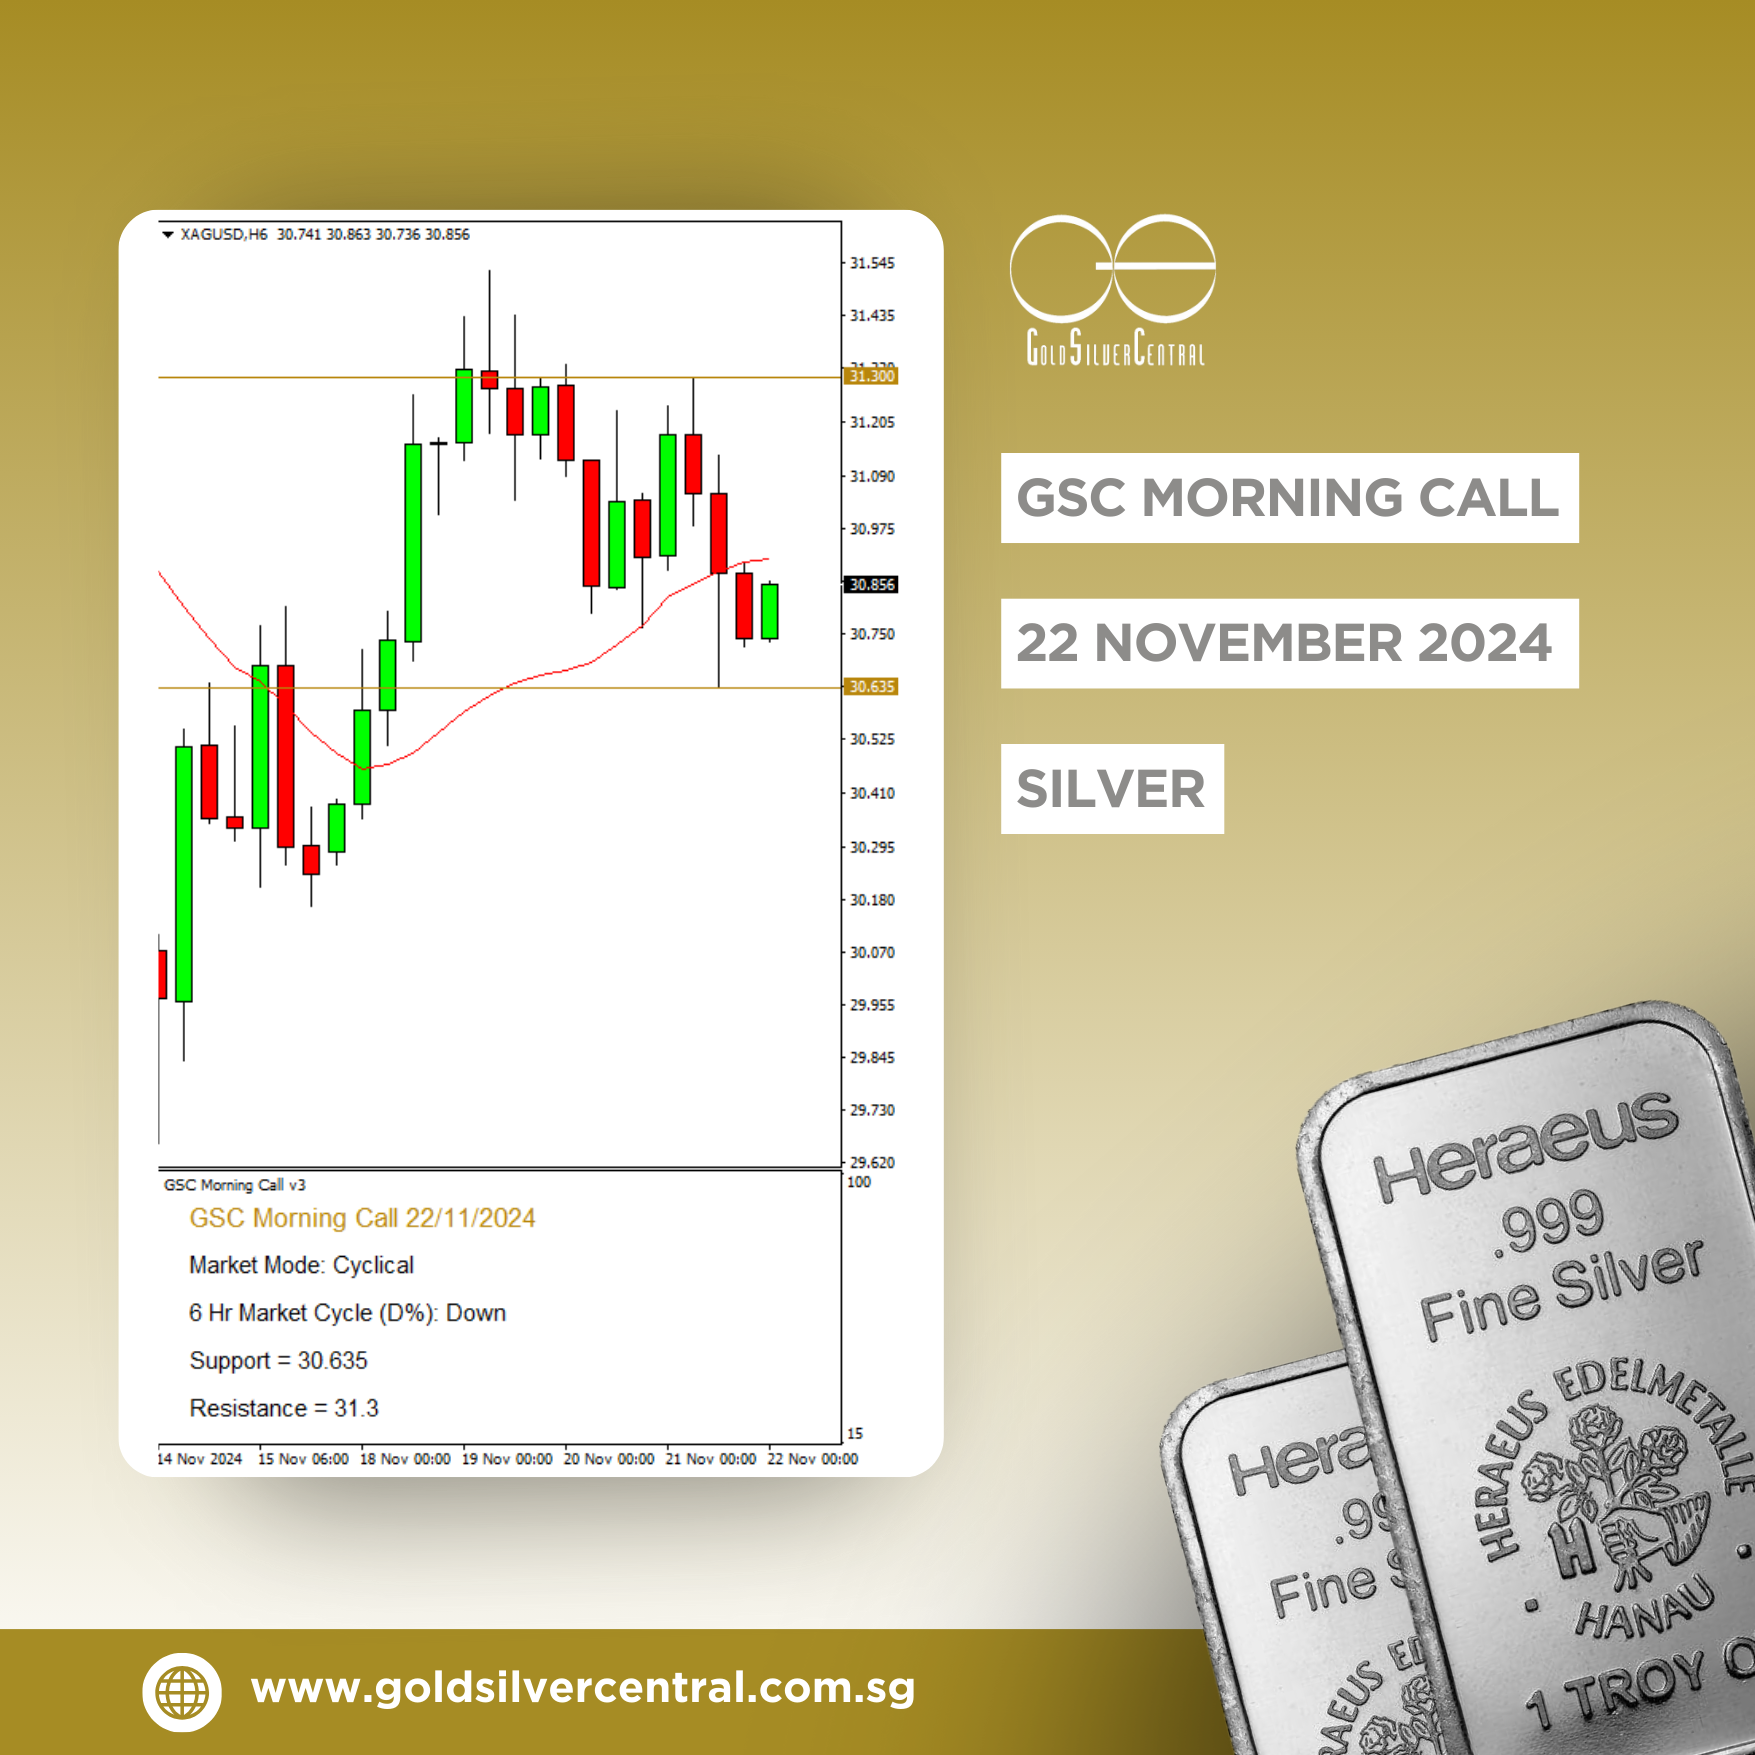
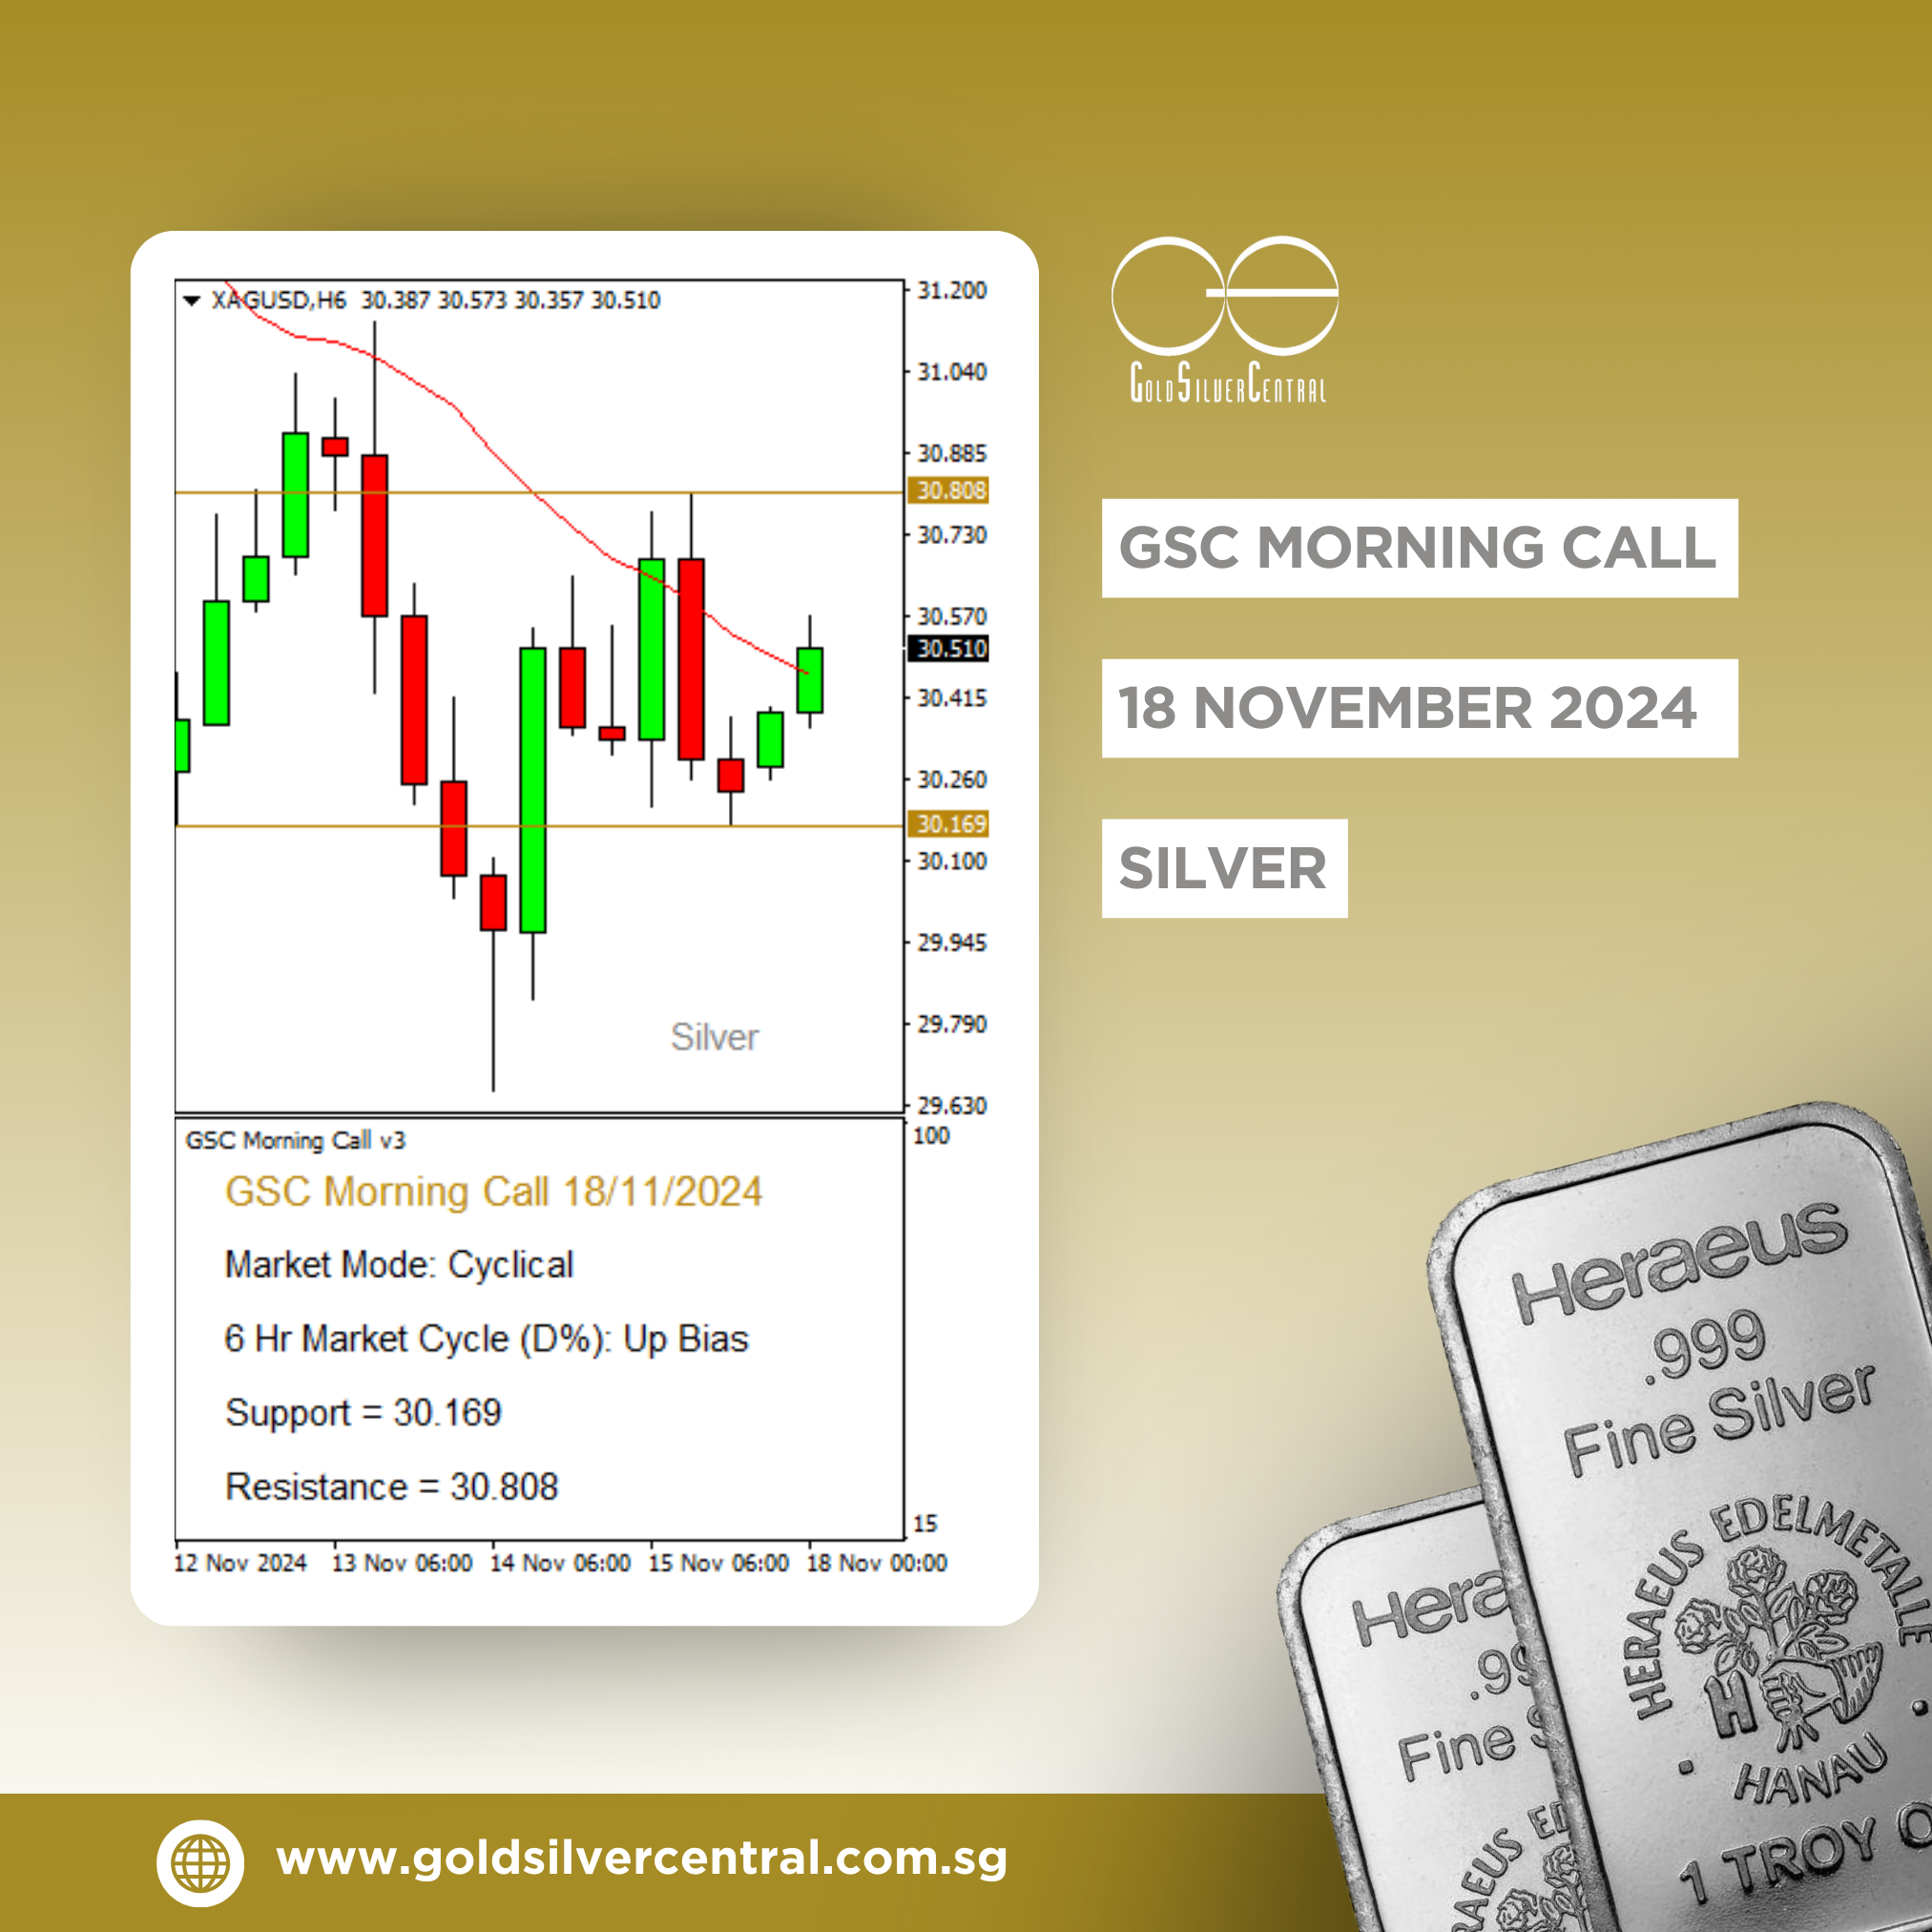
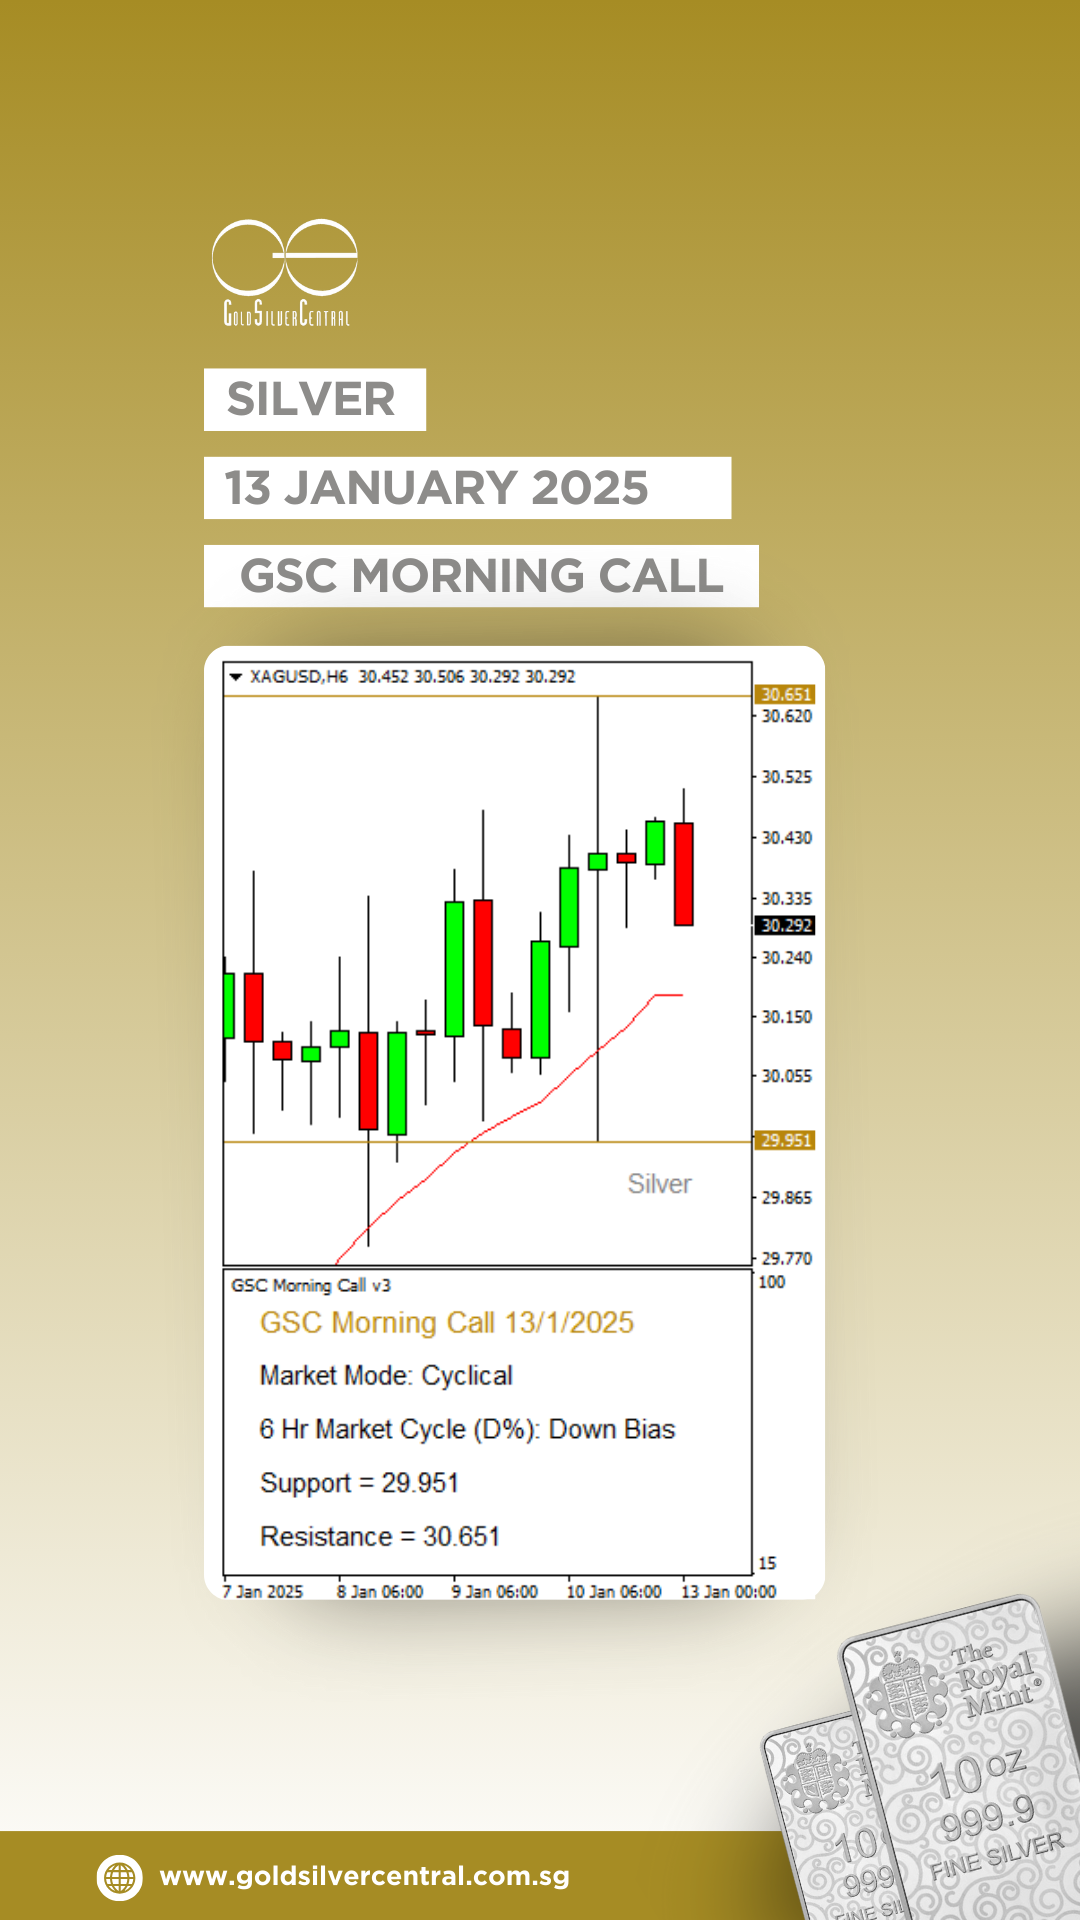
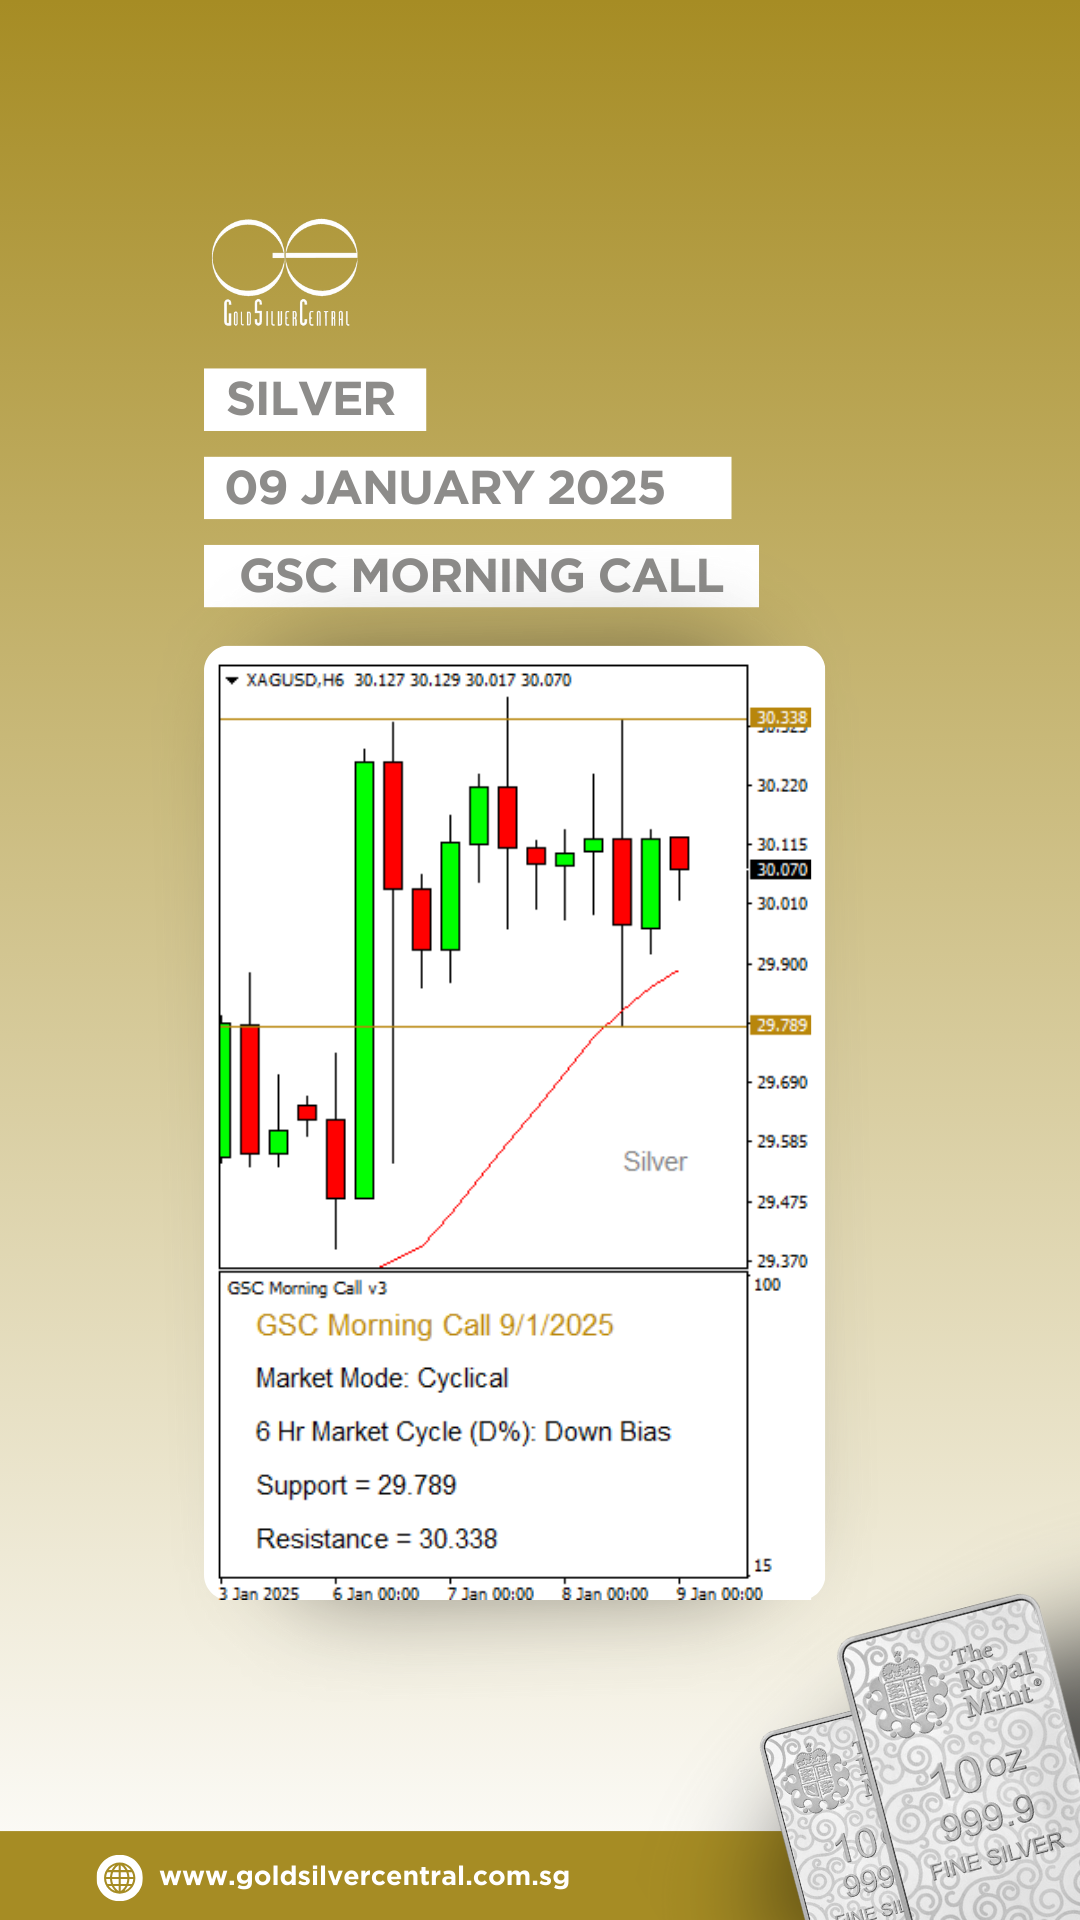
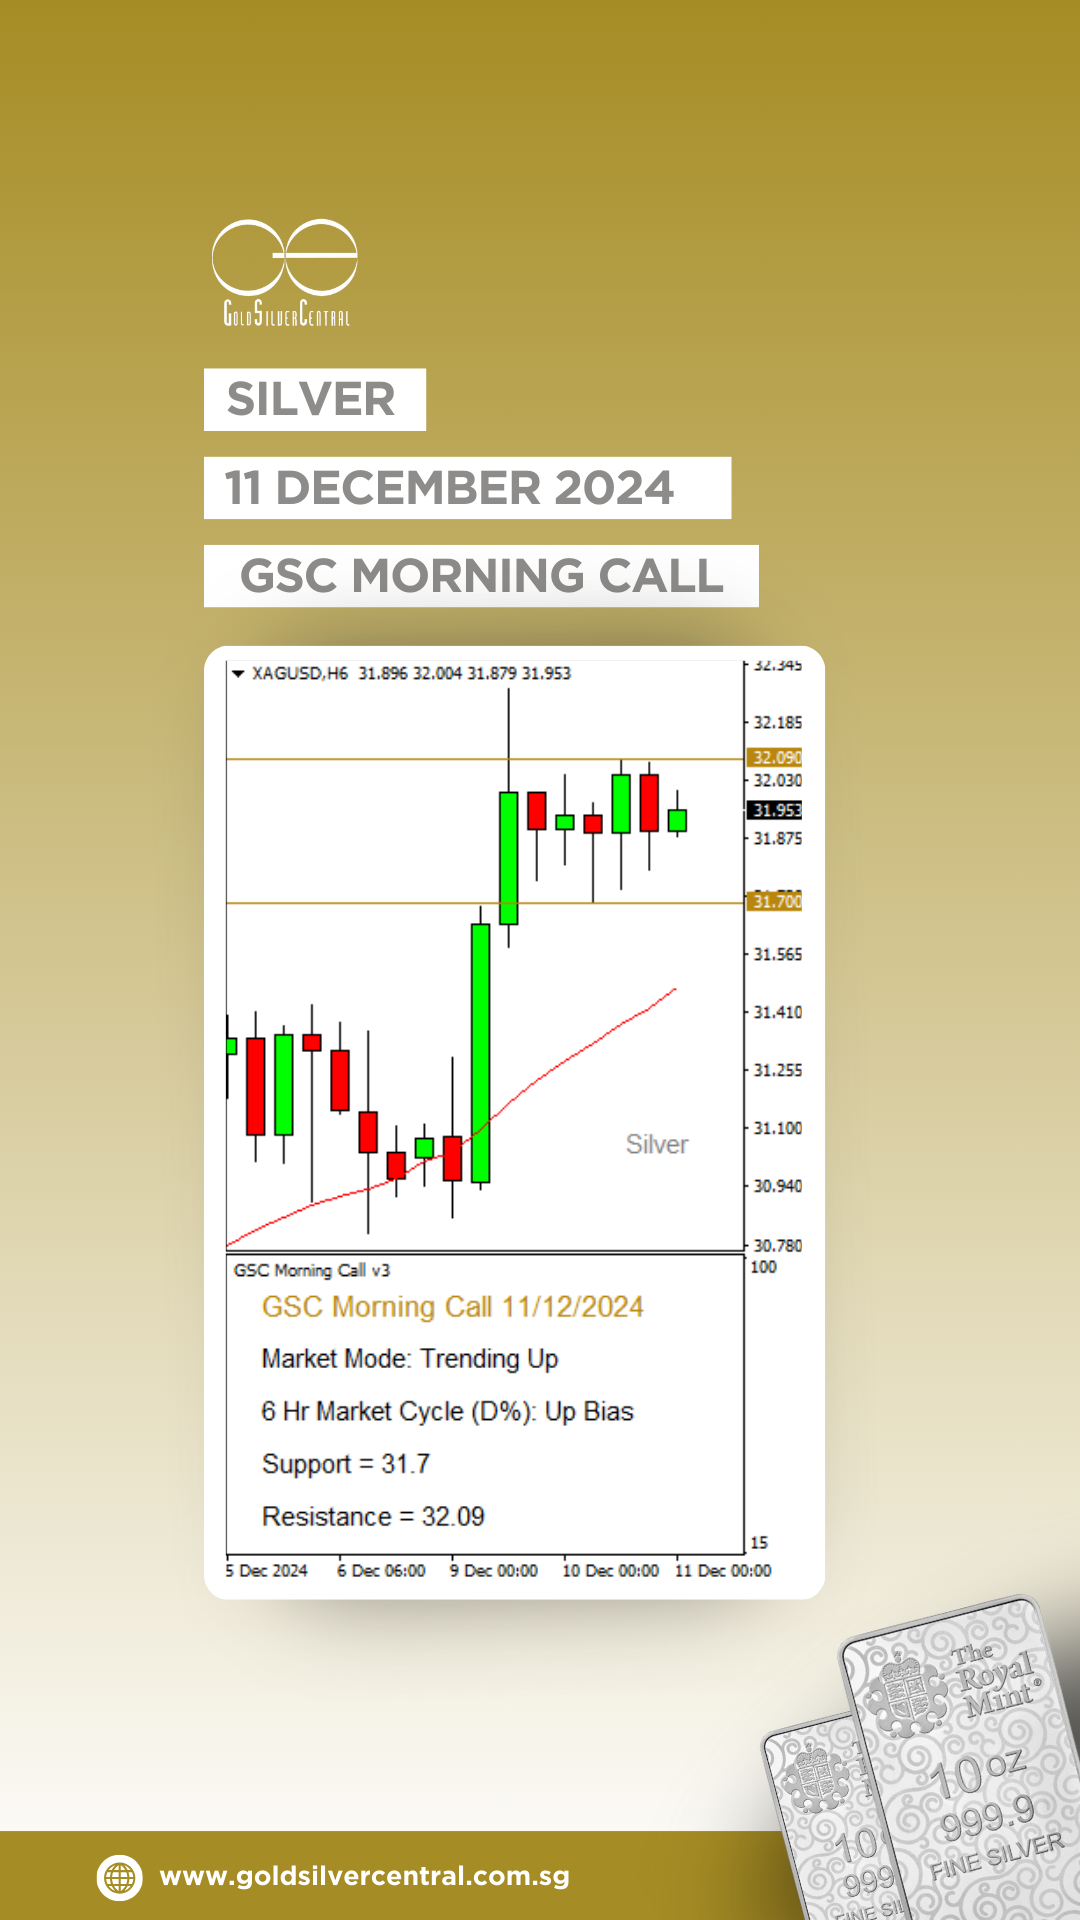
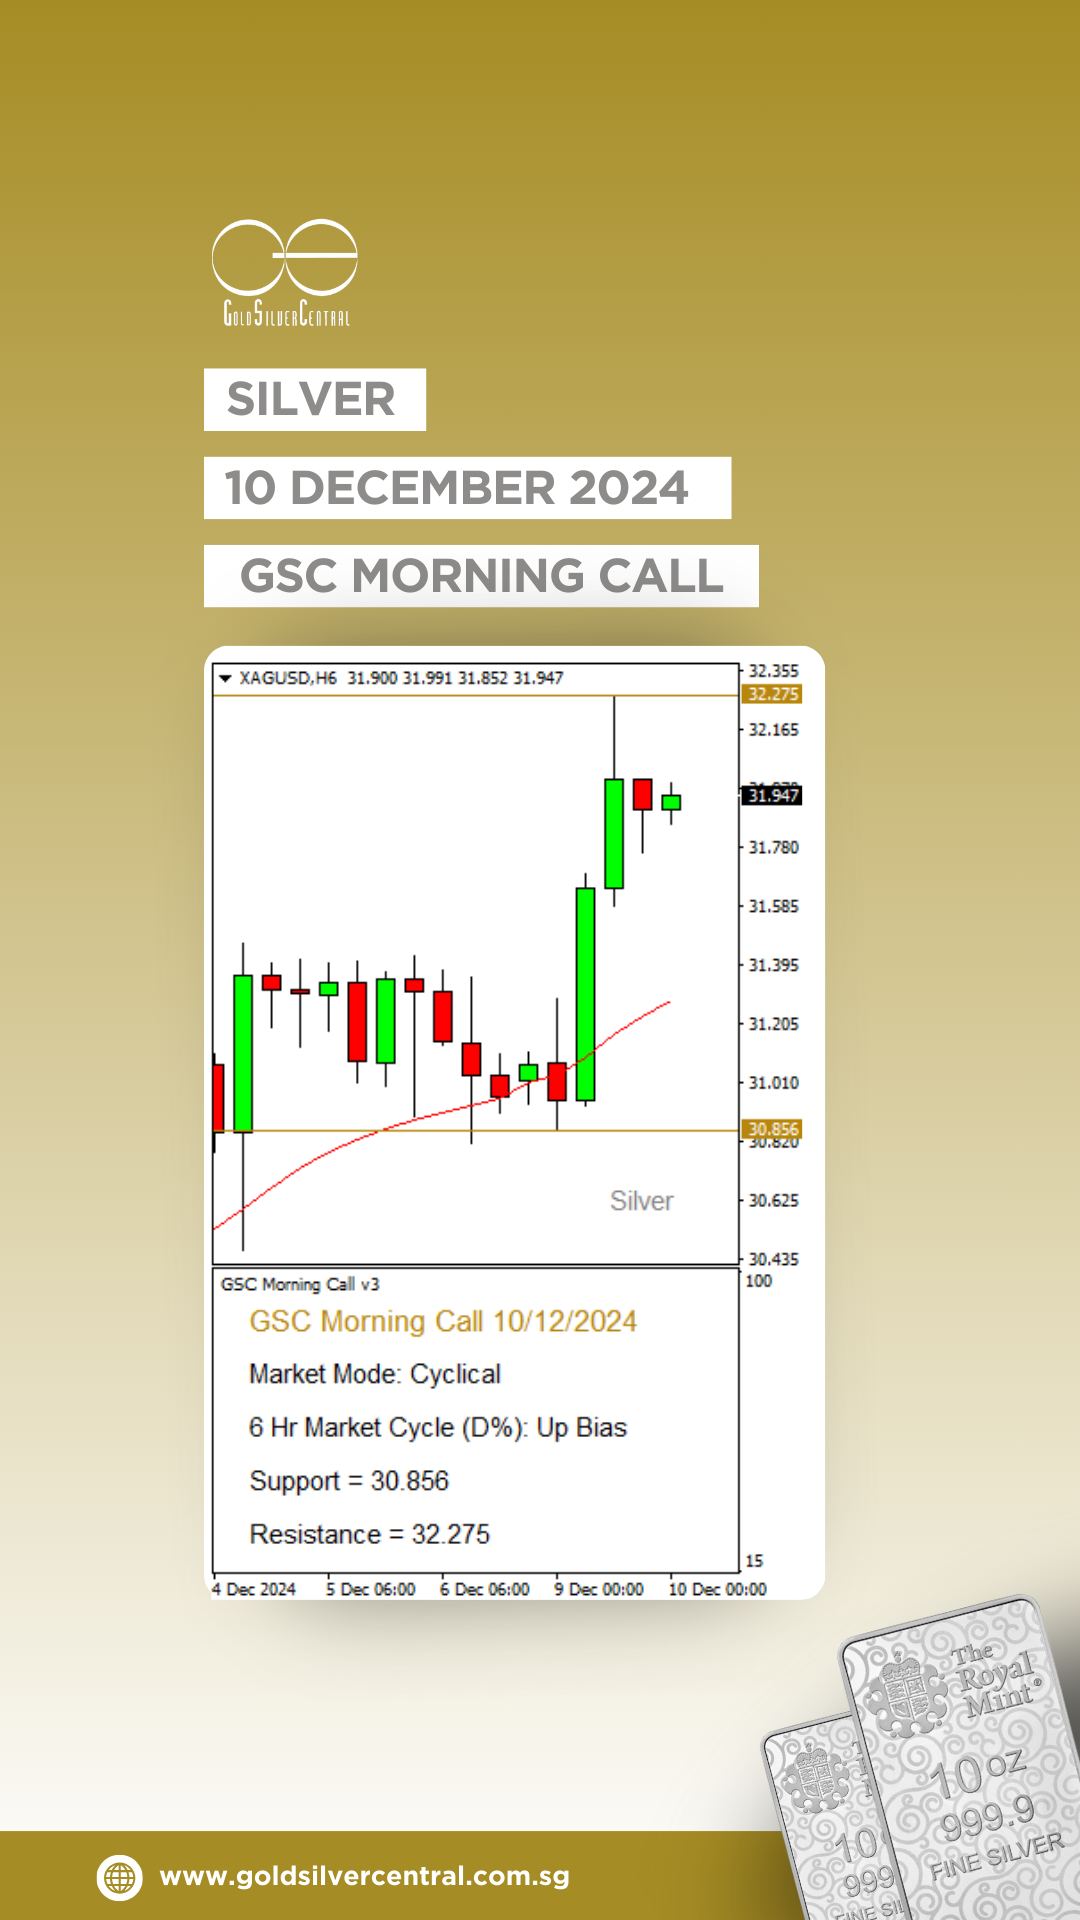
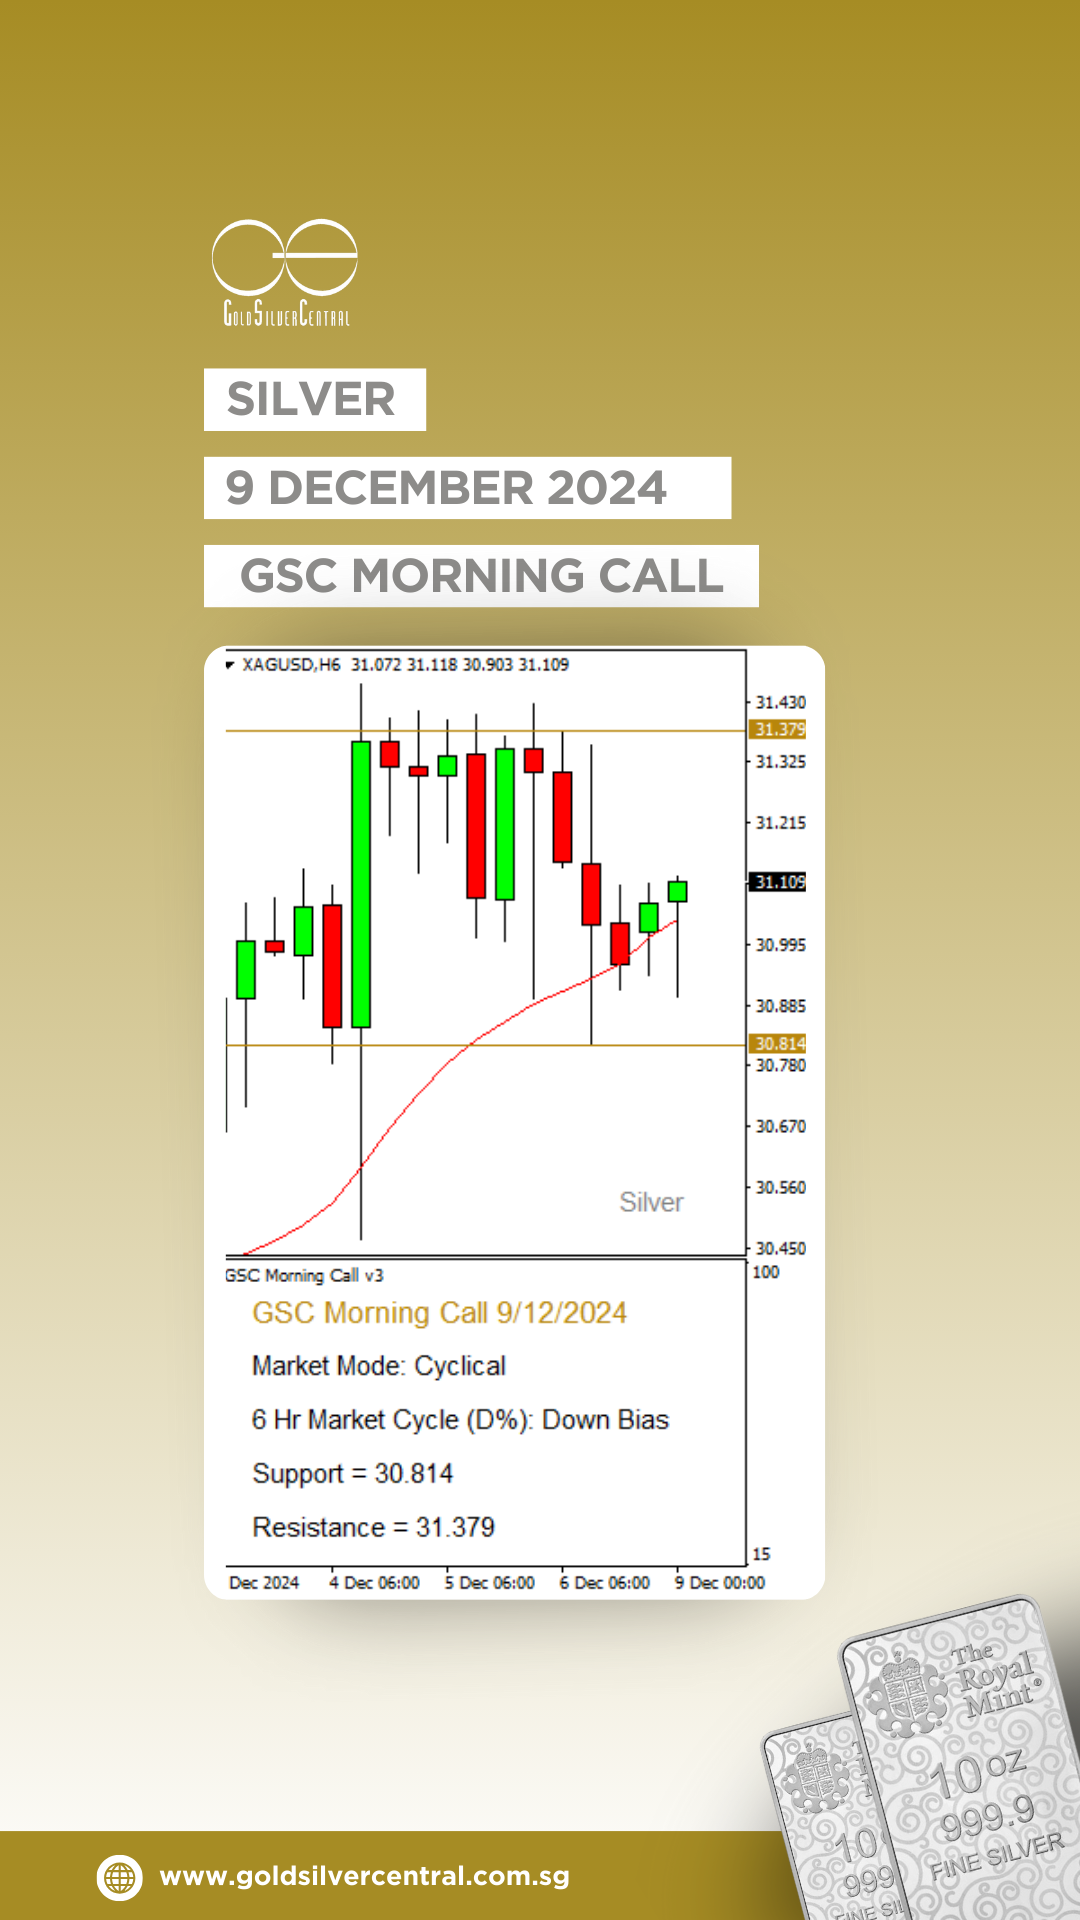
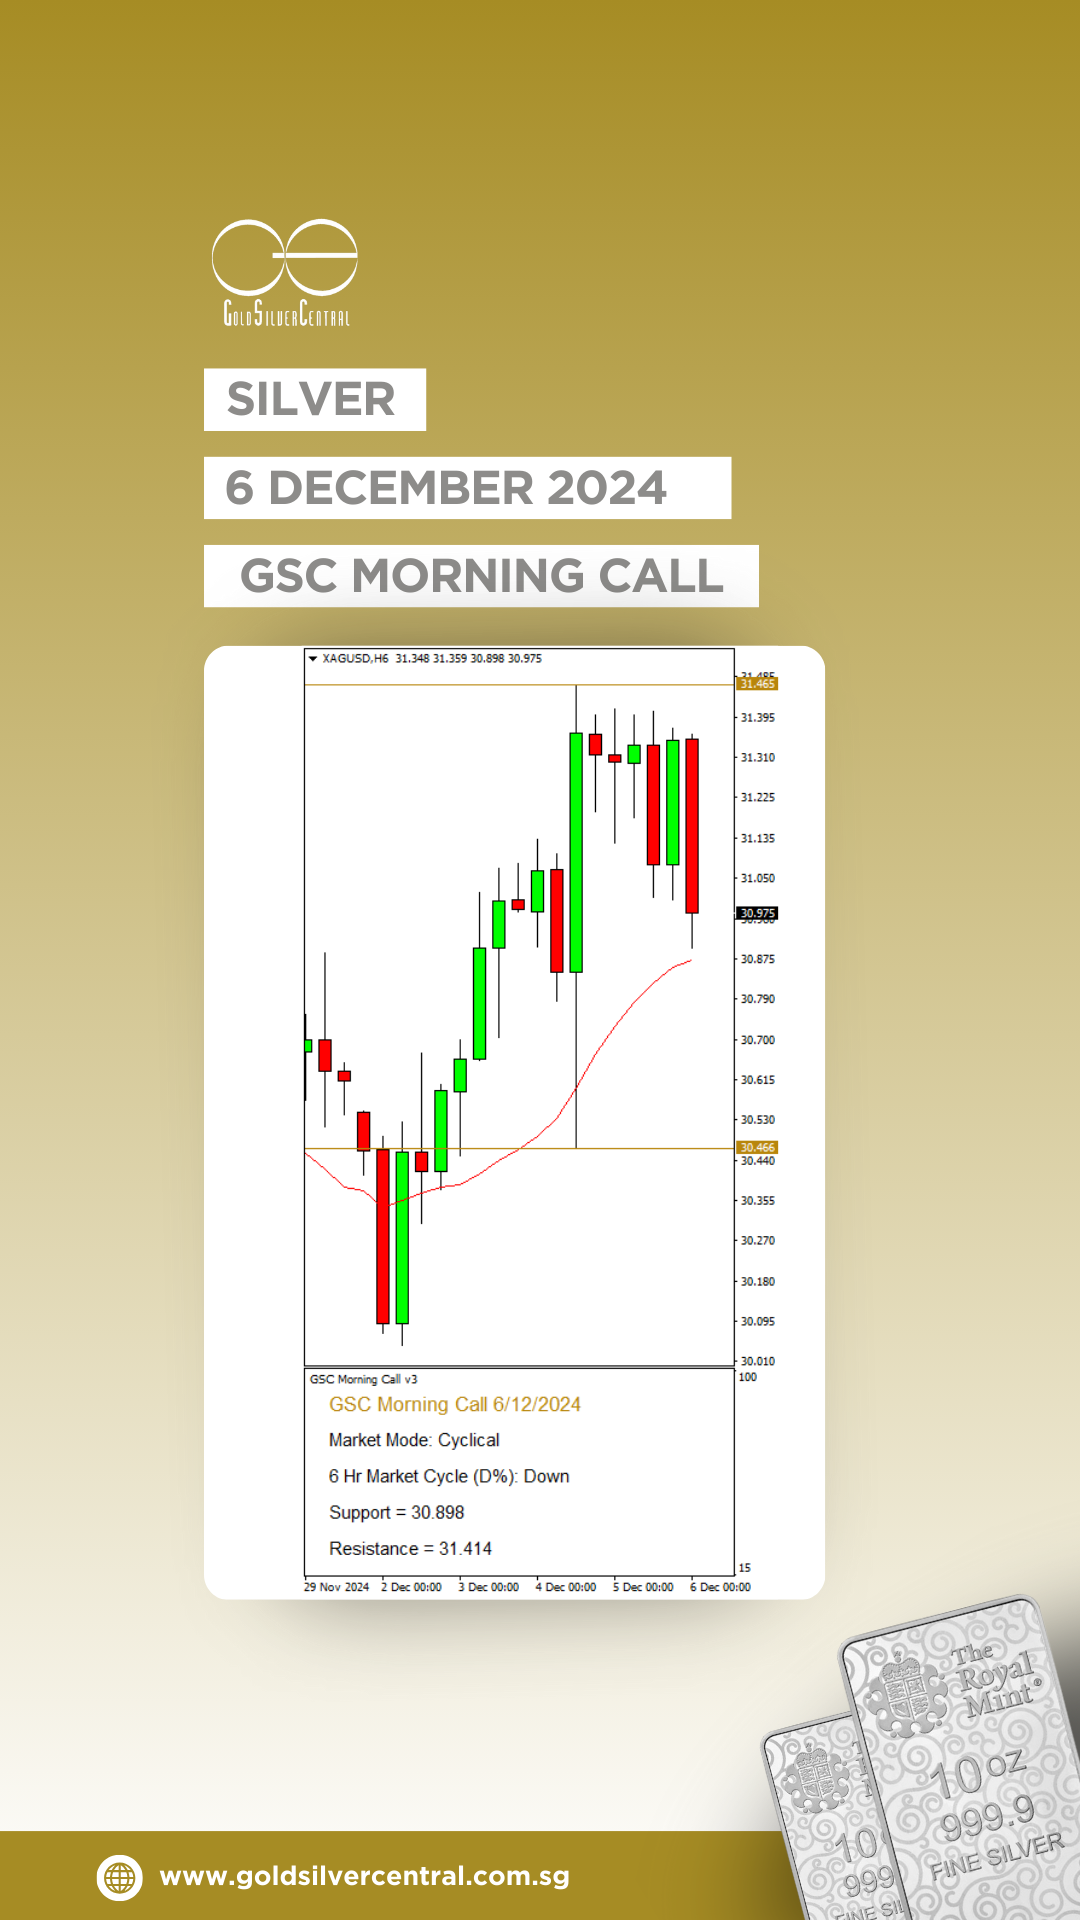
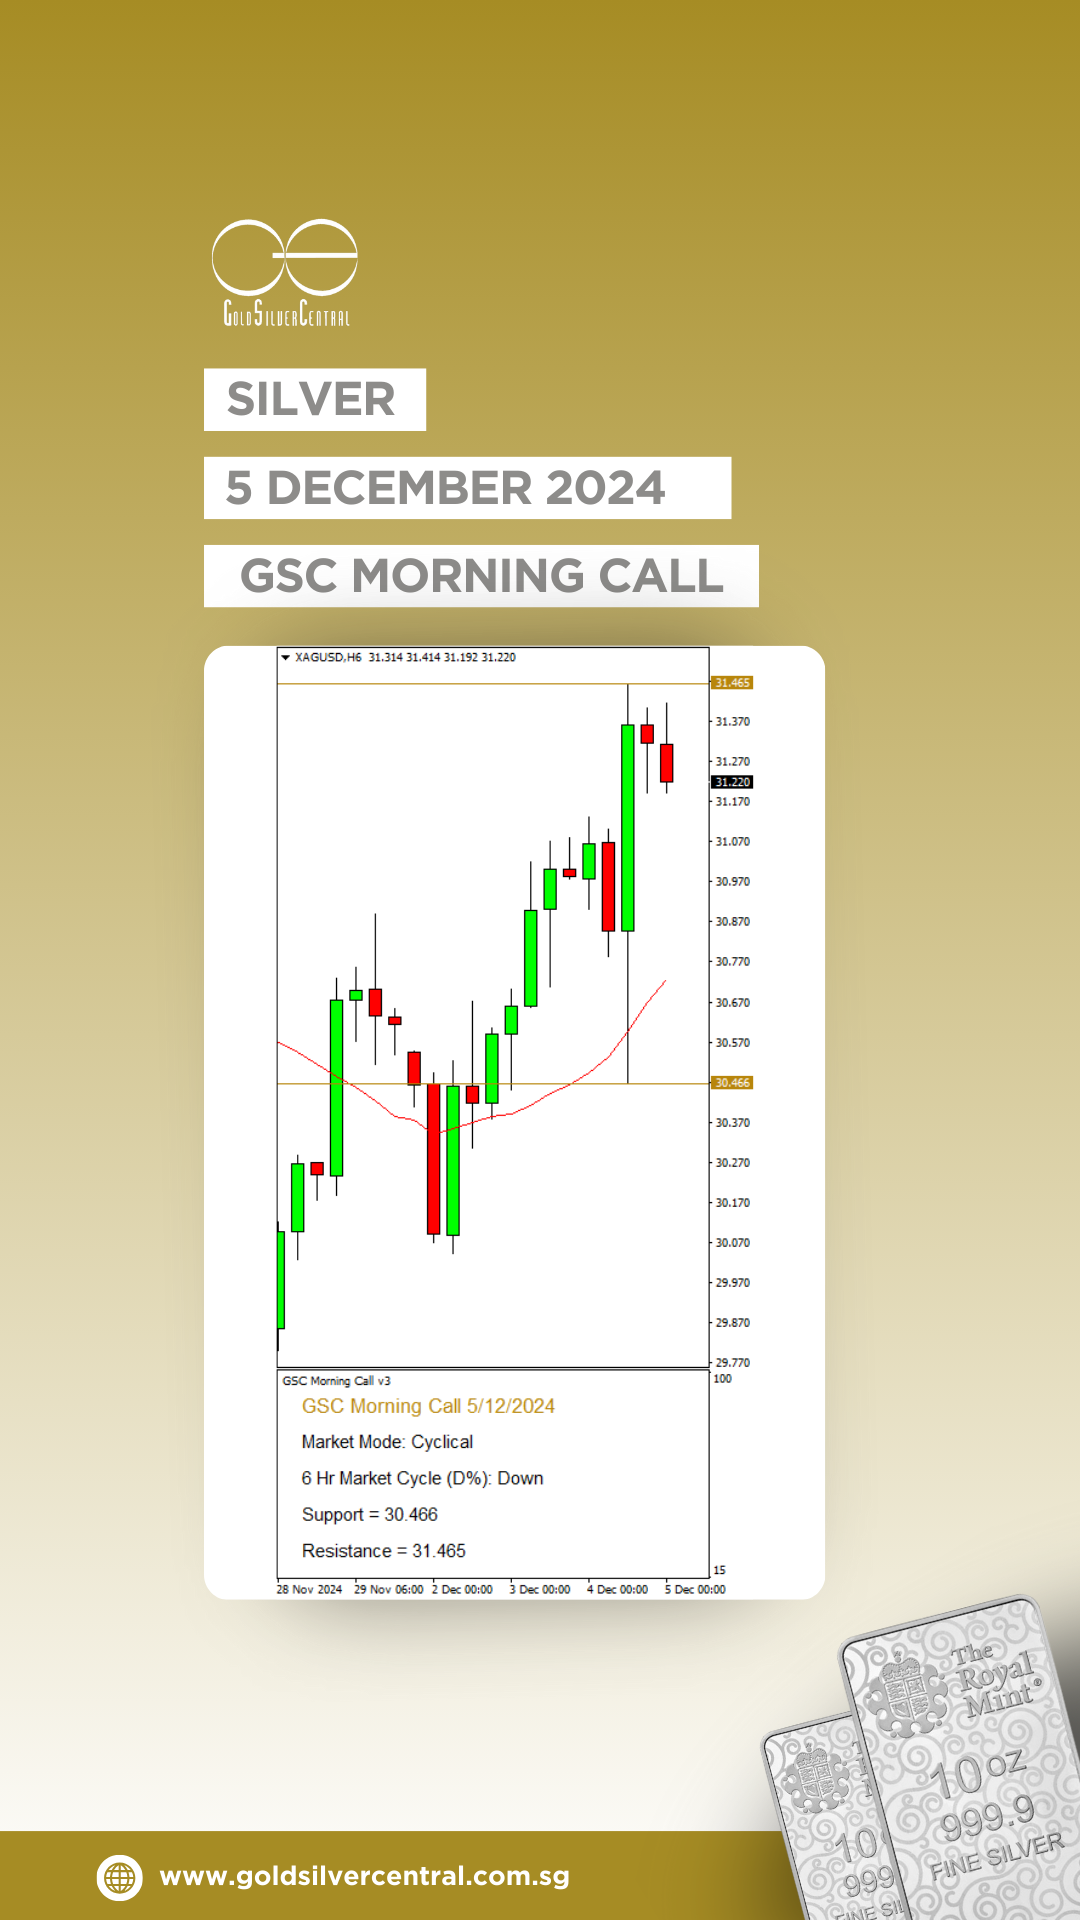
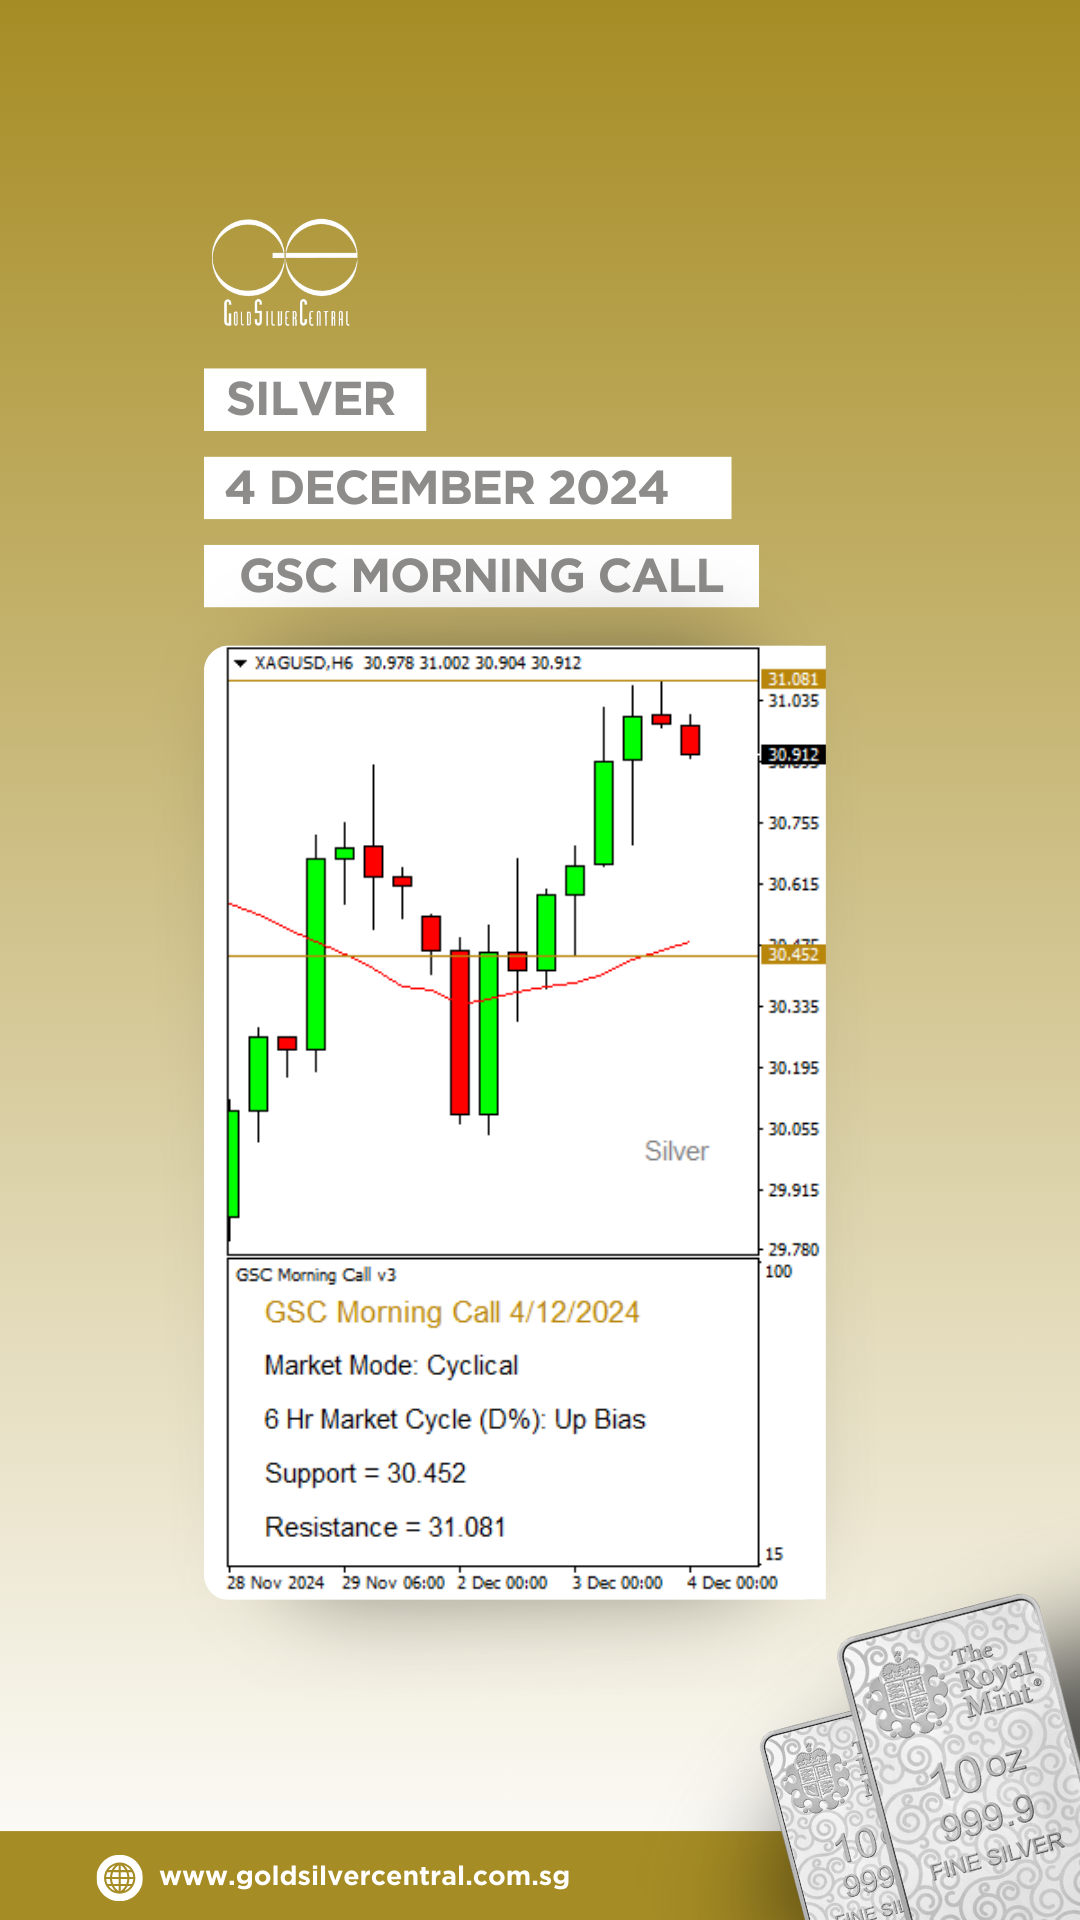
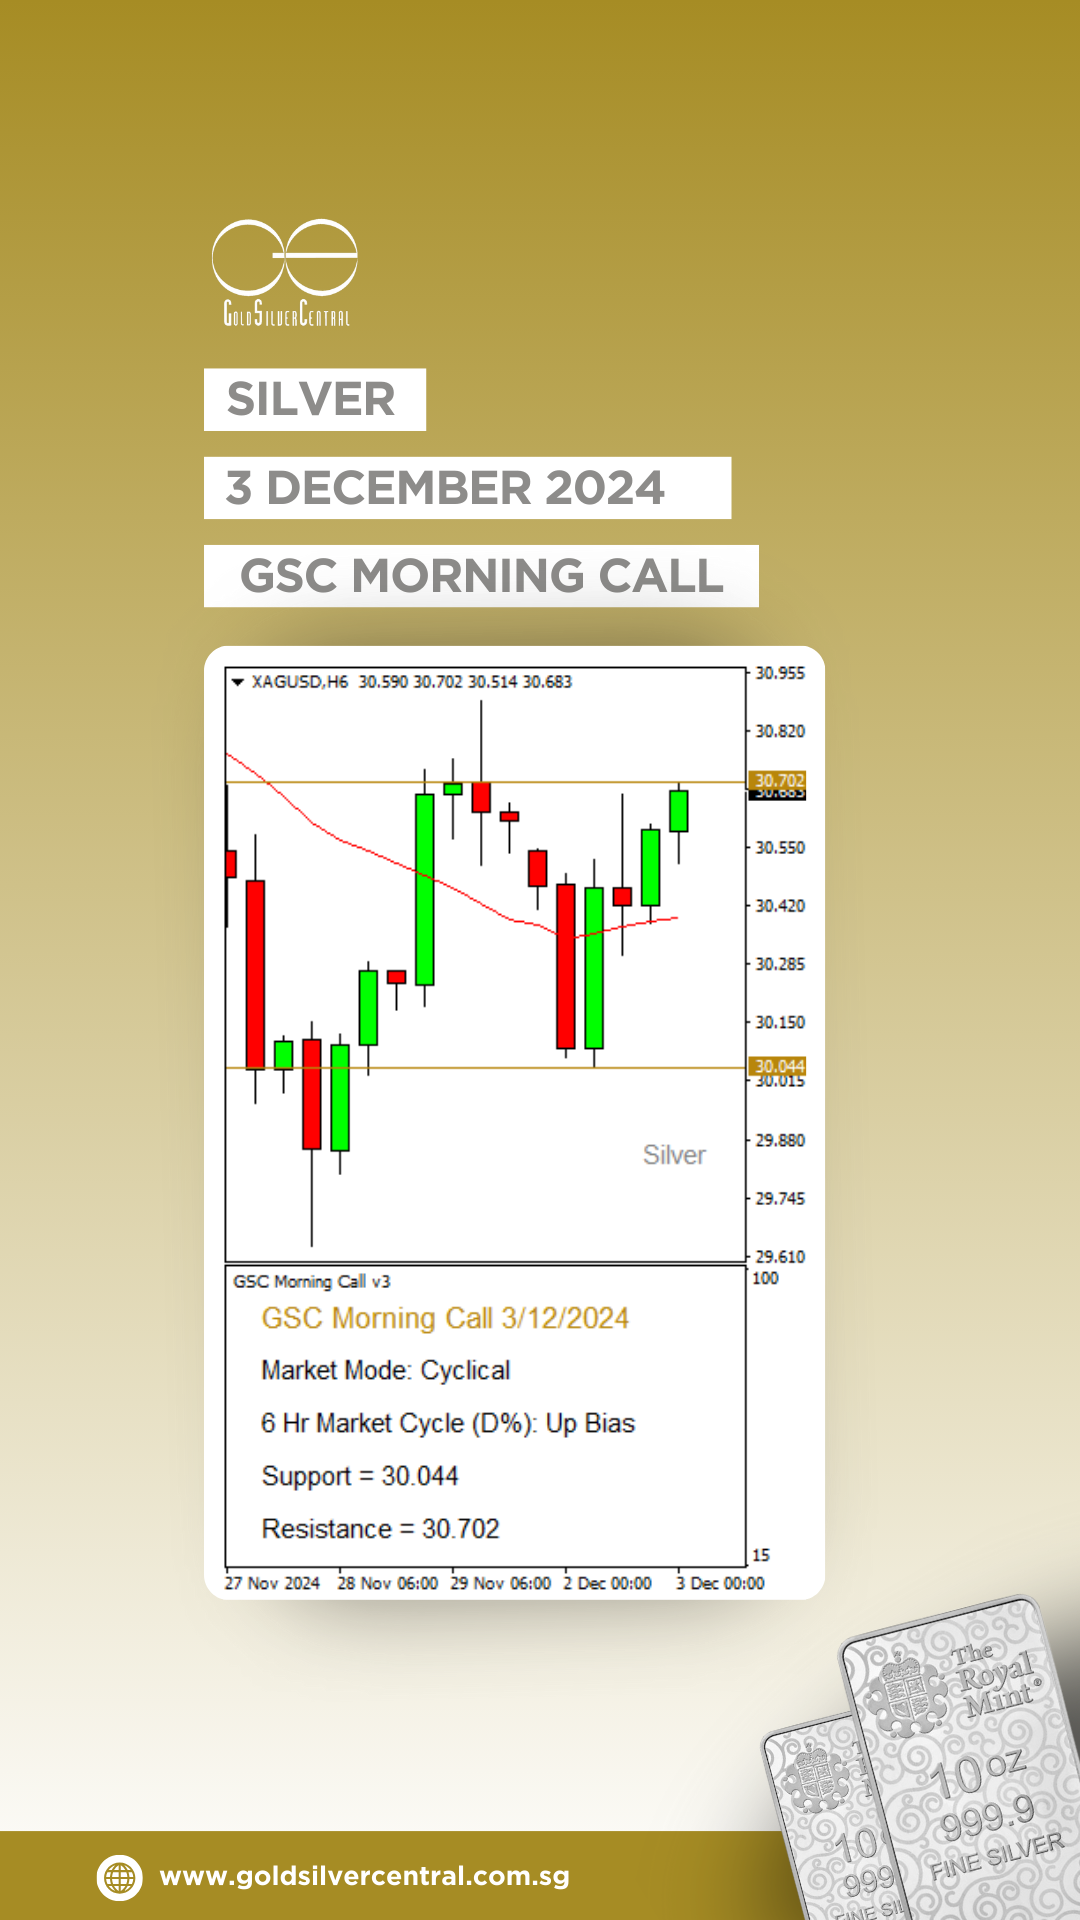
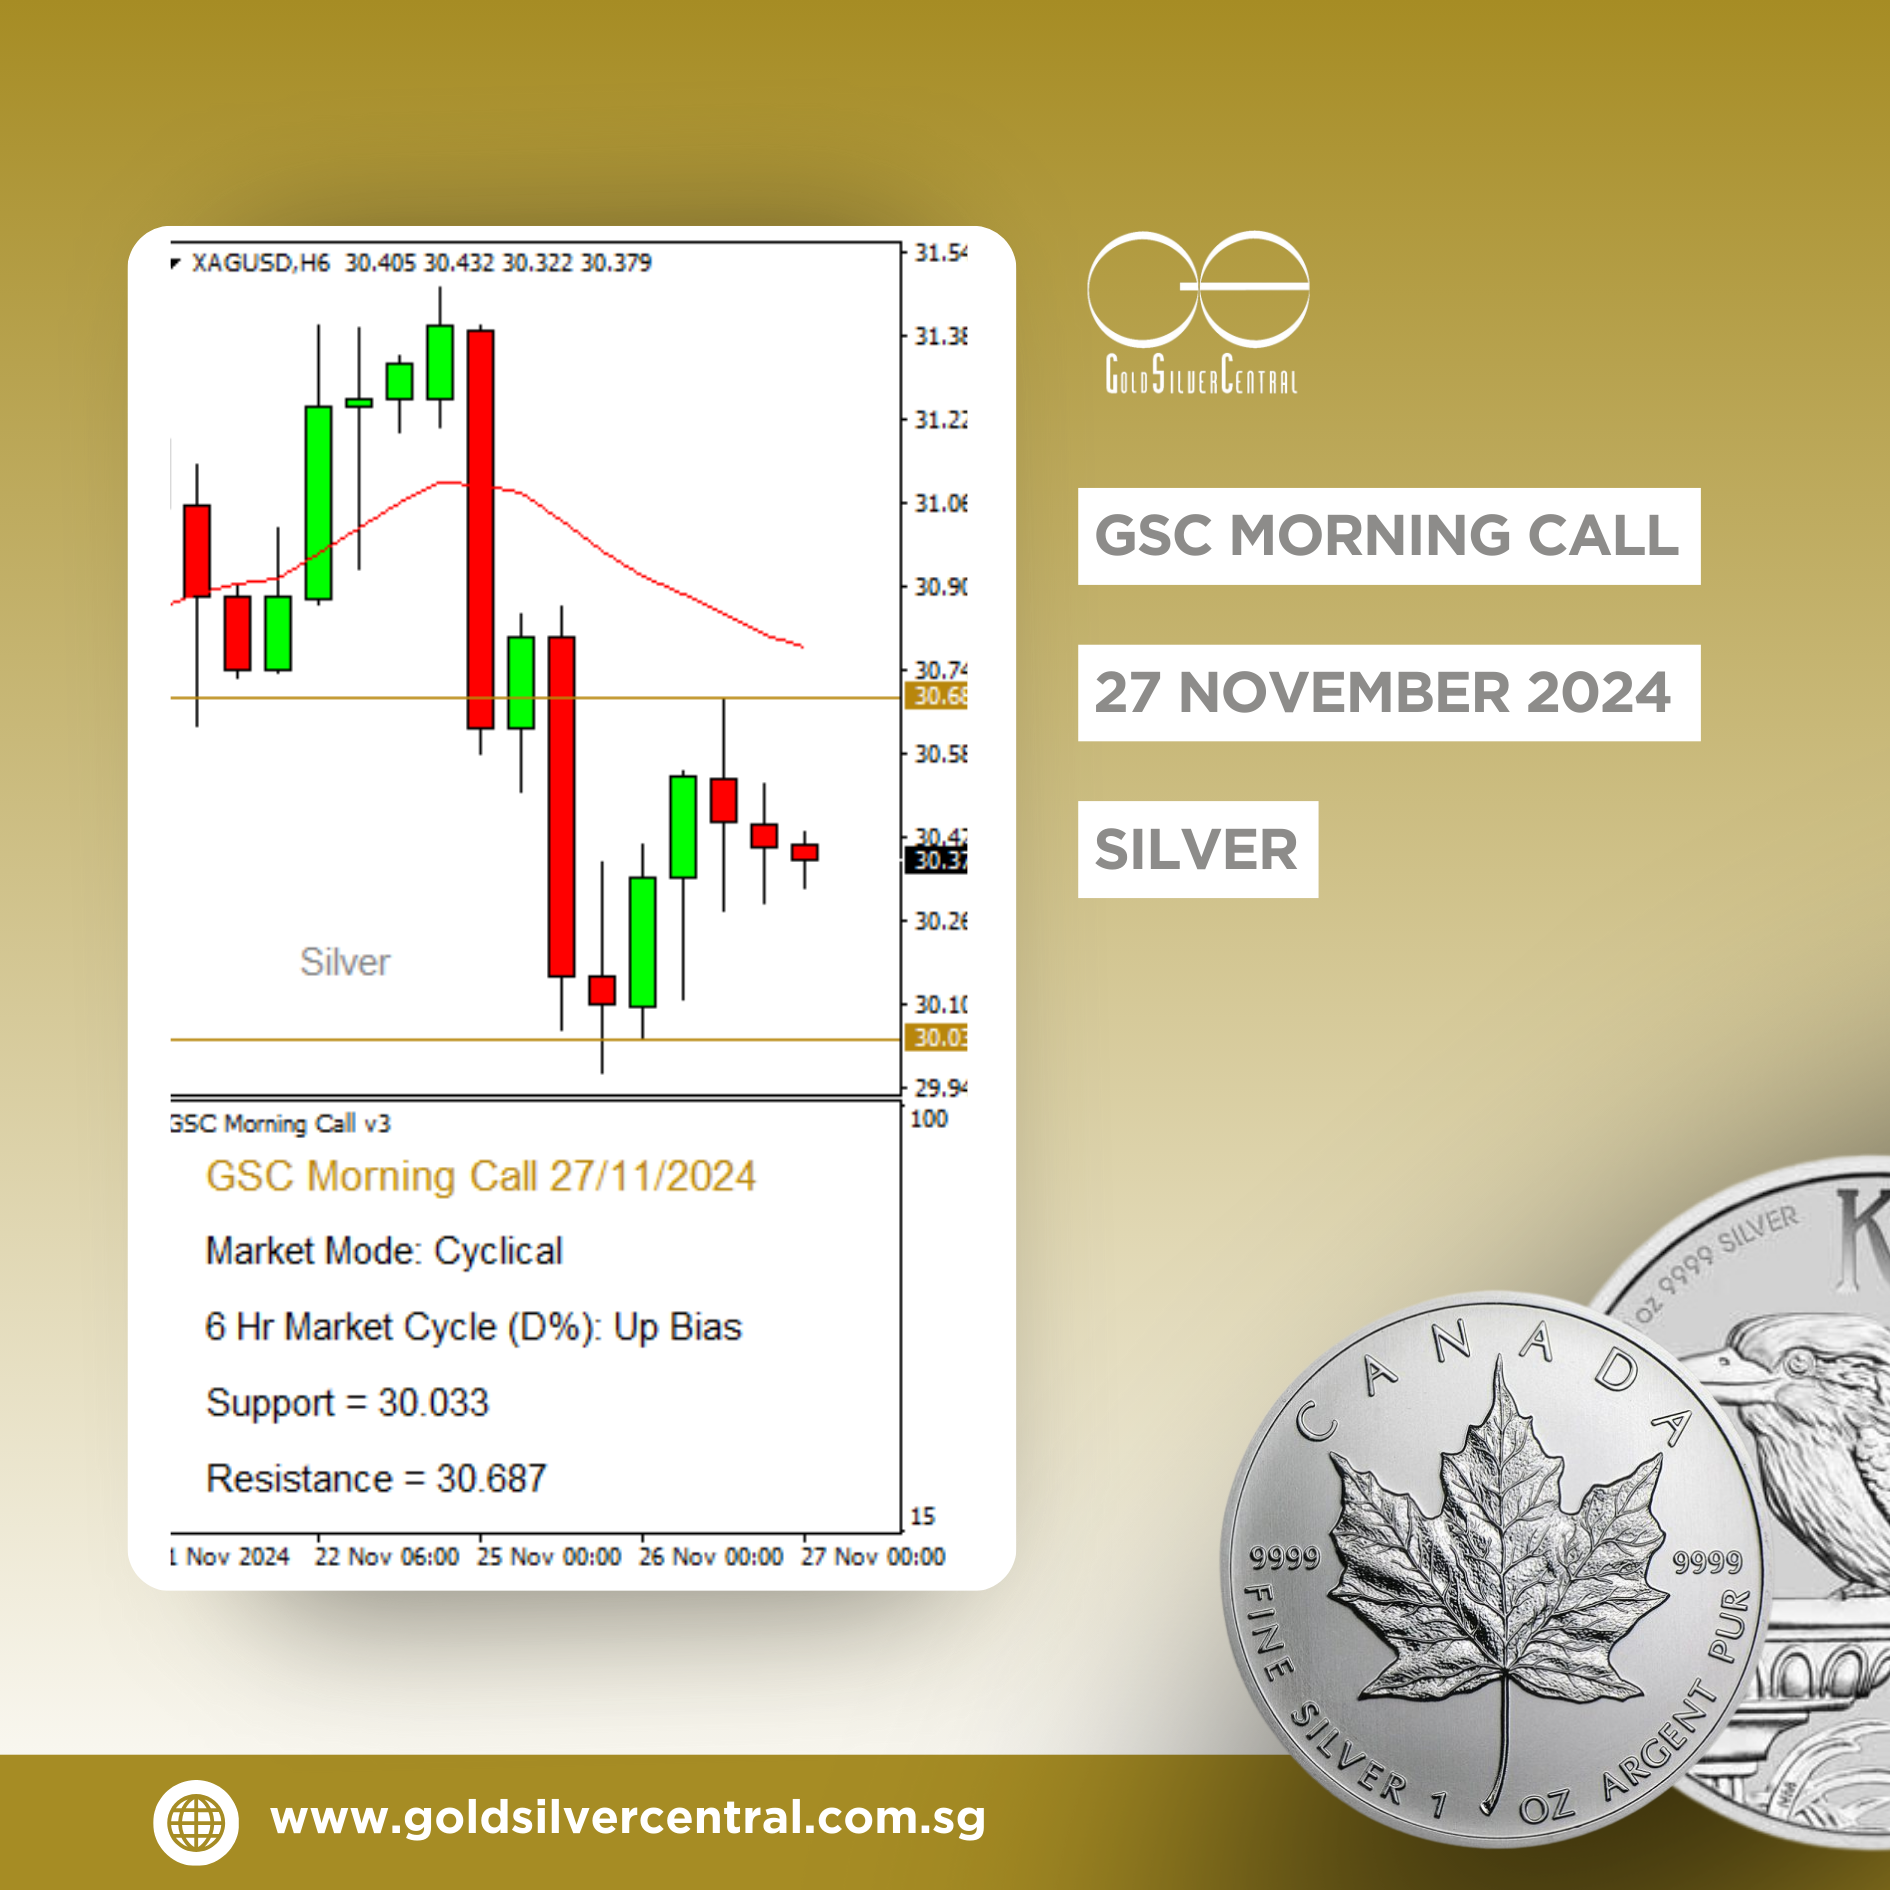
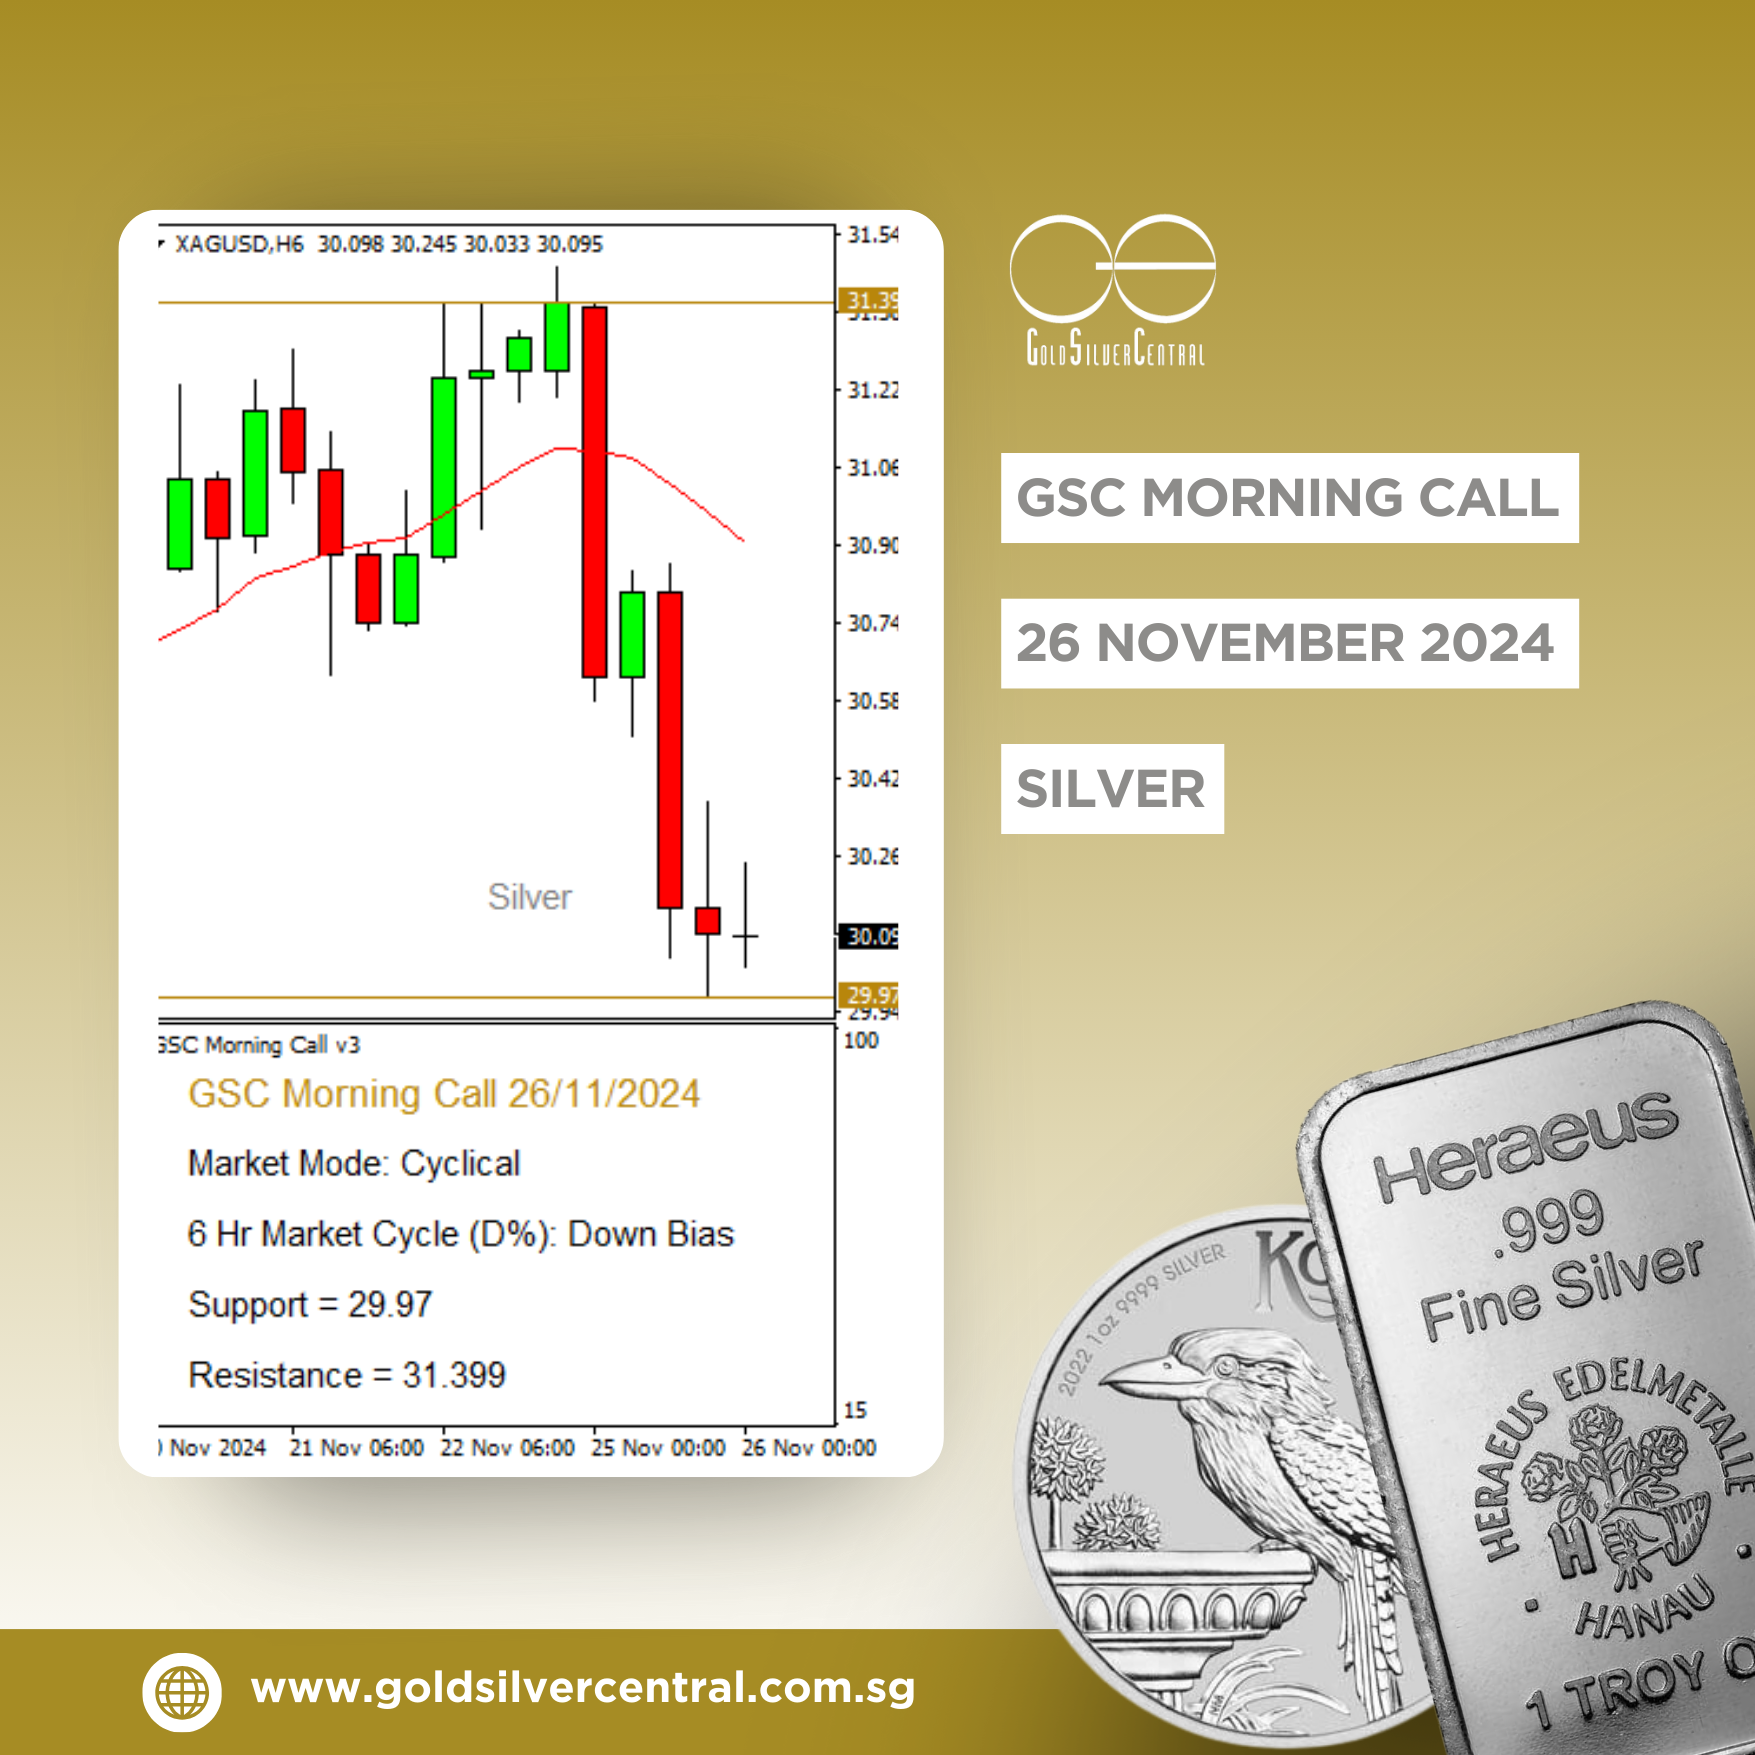
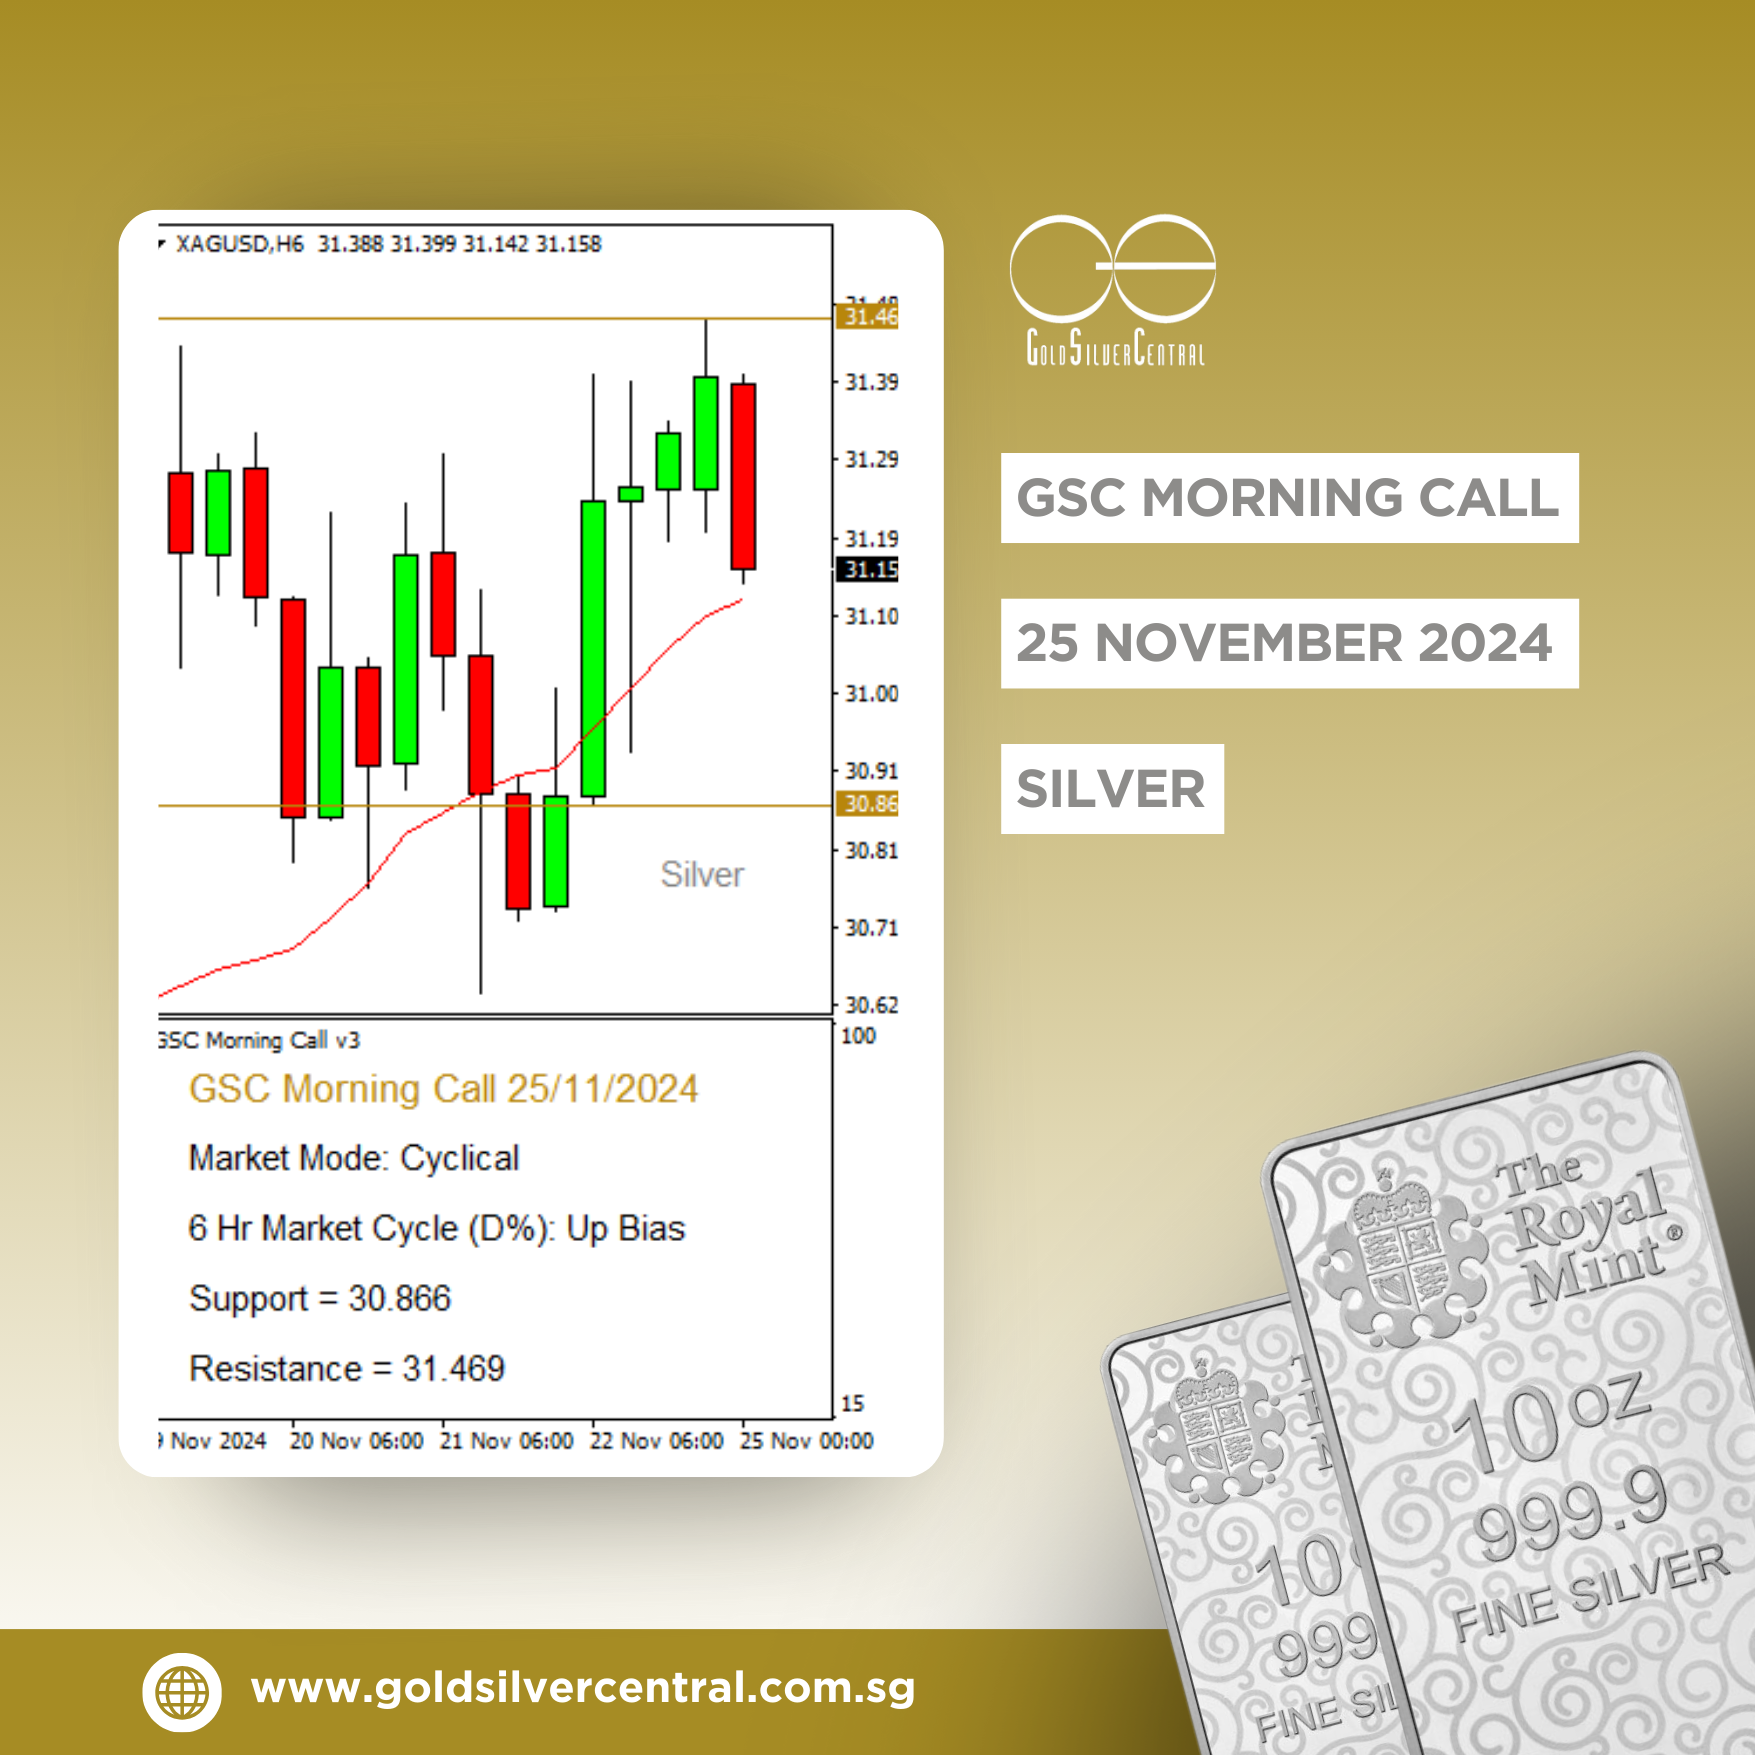
Insights from the GSC Morning Call
At GSC Morning Call, we provide daily insights to help traders navigate these phases effectively. Our analysis includes:
- Identifying Market Phases: Determine whether the day’s price action is likely to be trending or cyclical.
- Defining Bias: Highlight the underlying bias within each phase to guide trading strategies.
- Support and Resistance Levels: Offer indicative levels for planning entries and exits, minimizing risk.
By combining these insights with broader trend analysis, traders can position themselves to capitalize on opportunities while mitigating risks.
Want to know more?
Contact us via email ([email protected]) or WhatsApp (+65 6222 9703) to receive actionable analysis that empowers your trading decisions. Let us help you navigate the complexities of trending and cyclical markets with confidence.
")