
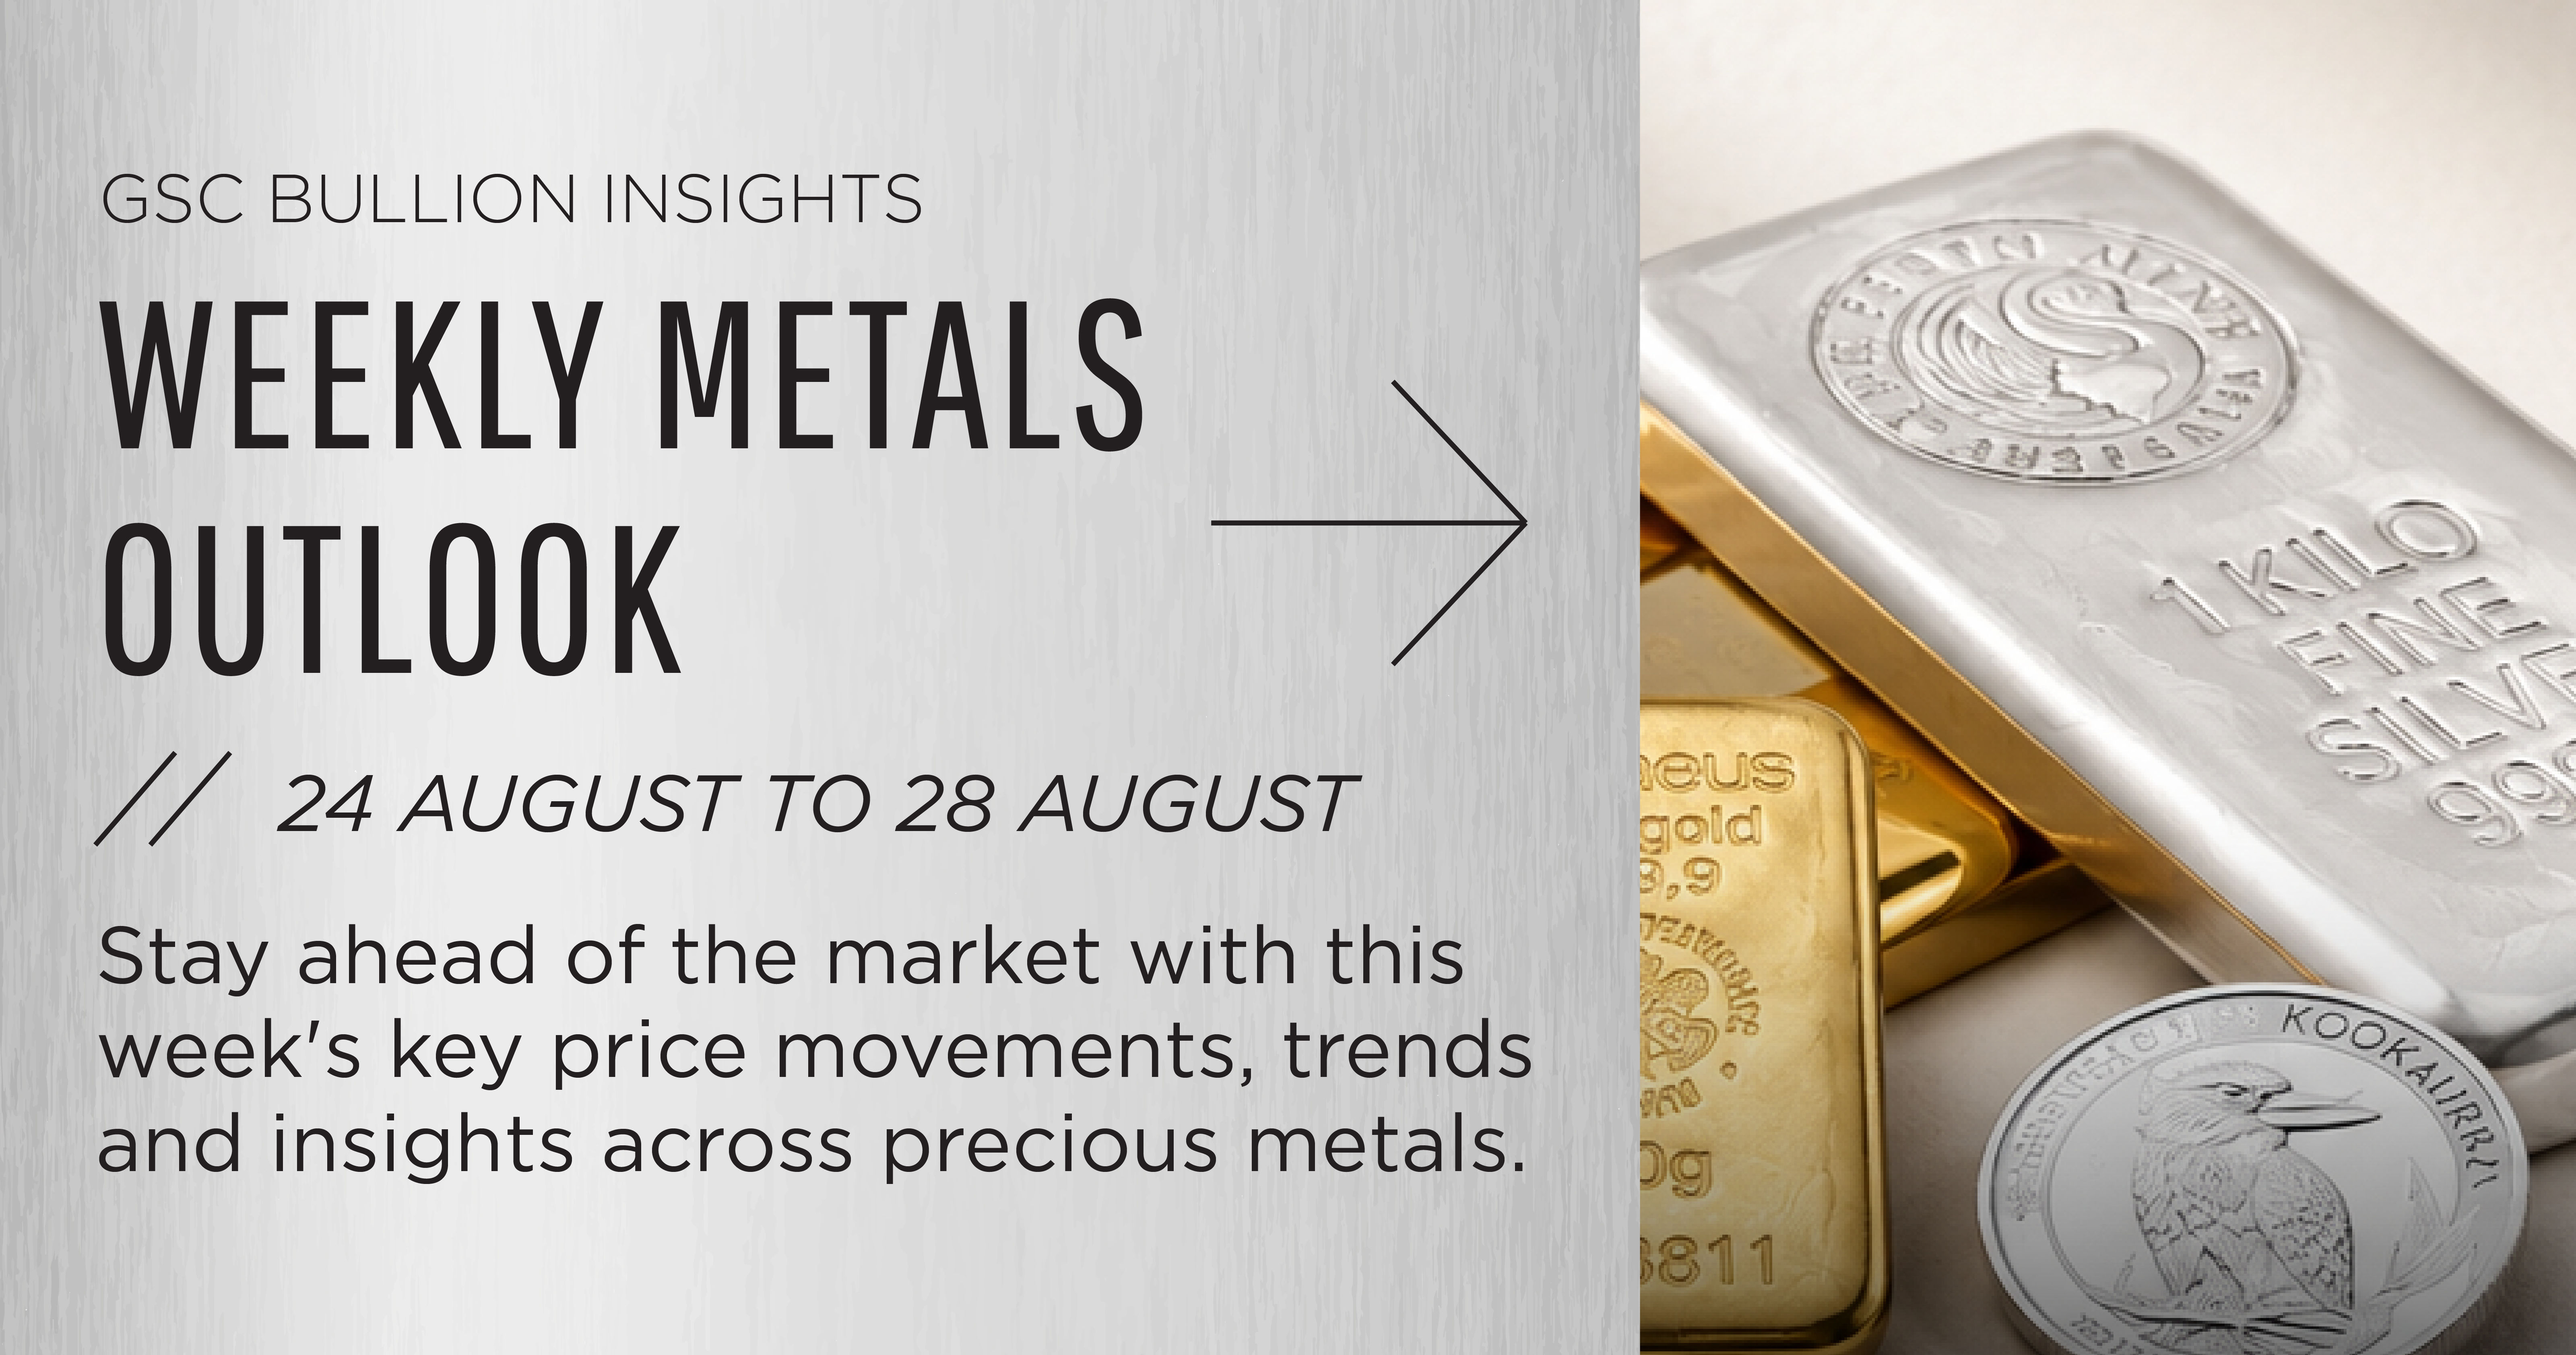

The precious metals complex has accelerated its upward expansion phase, with strong institutional buying driving prices to fresh local highs across Gold, Silver, and Platinum as technical barriers continue to yield to sustained upside order flow.
Gold has surged into new high territory following a decisive breakout past prior range resistance, leveraging robust buyer defense above the $4,522 support cushion to absorb overhead supply and push toward a peak of $4,6590.
Silver has similarly extended its bullish recovery, breaking above intermediate supply zones with aggressive momentum to test a high of $69.60, establishing a well-defined higher-low footprint above its $63.70 support baseline.
Platinum has decisively resolved its multi-week horizontal compression phase to the upside, breaking past its $1,832 intermediate barrier with expanding momentum to reach a peak of $1,887.
Overall, multi-timeframe price action across the metals complex reflects persistent bullish order flow and structural strength, positioning the market for broad trend-continuation tests ahead of key macroeconomic catalysts including US CB Consumer Confidence, Q2 GDP revisions and Core PCE Price Index data for the week of August 24–28, 2026. Please refer to the individual reports for more details.
Gold Weekly Outlook
Aggressive upside expansion pushes Gold into territory above $4,600
The multi-timeframe landscape for Gold reflects an accelerating bullish trend, marked by strong institutional demand that has comfortably absorbed overhead supply.
Daily price action shows a rapid sequence of green expansion candles breaking past intermediate consolidation limits. While the weekly chart shows price action extending well above its $4,297 breakout baseline, fast-moving oscillators and trend-strength metrics across both daily and weekly frames remain steeply sloped upward, confirming that buyers retain complete control over immediate order flow.
Consequently, technical probabilities favour a continuation of the primary uptrend toward the $4,657–$4,960 extension zone, with any short-term profit-taking expected to find solid defensive support at prior breakout levels.
Key Technical Levels
Support 1: ~$4,522–$4,561 (Immediate breakout-turned-support retest cushion)
Support 2: ~$4,297–$4,384 (Major prior consolidation structural baseline)
Resistance 1: ~$4,657–$4,960 (Recent swing high & immediate technical barrier)
Resistance 2: ~$5,295–$5,624 (Major upper structural expansion target)
Catalyst Events to Watch:
August 25 (Tue): US CB Consumer Confidence (Aug)
August 26 (Wed): US Preliminary Q2 GDP & Core PCE Price Index (Jul)
August 27 (Thu): US Initial Jobless Claims
—————————————————
Silver Weekly Outlook
Silver breaks toward $69.60 high as buying pressure intensifies
The multi-timeframe landscape shows Silver accelerating its upward trajectory, with price action breaking cleanly out of its prior consolidation range into a strong bullish expansion phase.
Daily price action has cleared intermediate support zones with a sequence of aggressive green expansion candles, reaching a peak of $69.60. The weekly chart displays a prominent green body advancing well above the $63.70 breakout baseline, confirming that intermediate buyers are in firm control of overall order flow. Momentum indicators across both timeframes remain steeply sloped upward, pointing toward active buying interest and low sell-side resistance.
Consequently, technical probabilities favour a continuation of the upward push toward the $69.60–$70.20 extension zone, with any short-term pullbacks expected to find solid defensive support around prior breakout levels.
Key Technical Levels
Support 1: ~$63.70–$64.30 (Immediate breakout-turned-support cushion)
Support 2: ~$55.50–$58.40 (Major primary multi-month foundational baseline)
Resistance 1: ~$69.60–$70.20 (Recent swing high & immediate technical barrier)
Resistance 2: ~$78.40–$93.20 (Major upper structural extension target zone)
Catalyst Events to Watch:
August 25 (Tue): US CB Consumer Confidence (Aug)
August 26 (Wed): US Preliminary Q2 GDP & Core PCE Price Index (Jul)
August 27 (Thu): US Initial Jobless Claims
—————————————————
Platinum Weekly Outlook
Platinum coils in tight horizontal band as buying pressure normalizes
The multi-timeframe landscape shows Platinum decisively resolving its recent horizontal compression phase to the upside, shifting into an active bullish expansion posture.
Daily price action has cleared prior range resistance near $1,771 with a strong sequence of green candles, reaching a peak of $1,887. The weekly chart displays a strong green body advancing past the $1,832 intermediate resistance, confirming that buyers have taken firm control of broad structural order flow. Fast momentum indicators and trend strength lines across both daily and weekly frames are expanding upward into overbought territory, signalling strong buyer enthusiasm and minimal sell-side interference.
Consequently, technical probabilities favour a continuation of the primary recovery toward the $1,887–$1,913 resistance zone, with any minor pullbacks expected to find solid defensive support around prior breakout levels.
Key Technical Levels
Support 1: ~$1,832–$1,841 (Immediate breakout-turned-support retest cushion)
Support 2: ~$1,696–$1,768 (Major prior consolidation structural baseline)
Resistance 1: ~$1,887–$1,913 (Recent swing high & immediate technical barrier)
Resistance 2: ~$2,110–$2,382 (Major upper structural extension target zone)
Catalyst Events to Watch:
August 25 (Tue): US CB Consumer Confidence (Aug)
August 26 (Wed): US Preliminary Q2 GDP & Core PCE Price Index (Jul)
August 27 (Thu): US Initial Jobless Claims
—————————————————
For more Bullion Insights, join GoldSilver Central’s Telegram channel or subscribe to our Bullion Insights Newsletter.