



The Precious Metals market is officially taking a breather in Q3 2026, transitioning from a historic speculative sprint into a necessary downward correction. While short-term selling pressure is currently driving defensive consolidation, our trading floor sees this as a healthy flush-out rather than a structural regime change. Over the coming quarter, expect Gold to test crucial structural support near the $3,900–$4,000 threshold, Silver to chop lower in search of a definitive floor, and Platinum to experience volatile swings toward the $1,500–$1,600 zone as the overarching bull market gradually moves back into historical value areas where institutional buyers are waiting.
This outlook is backed by 15 years of proven market expertise from GoldSilver Central. Specializing in real-time physical bullion trading, collateral loans, and secured storage at the Singapore Freeport, our leadership team delivers institutional-grade intelligence directly to your physical investments. As a proud SBMA member and an Authorised Distributor for the Perth Mint, Royal Mint, and TianXinYang, we cut through the noise so you can navigate this market volatility with confidence. Dive into our individual market breakdowns below to prepare your portfolio for the quarter ahead.
Quarterly Outlook (Q3 2026) for Gold (XAU/USD)
Bulls Defend the Floor, But Bears Control the Momentum
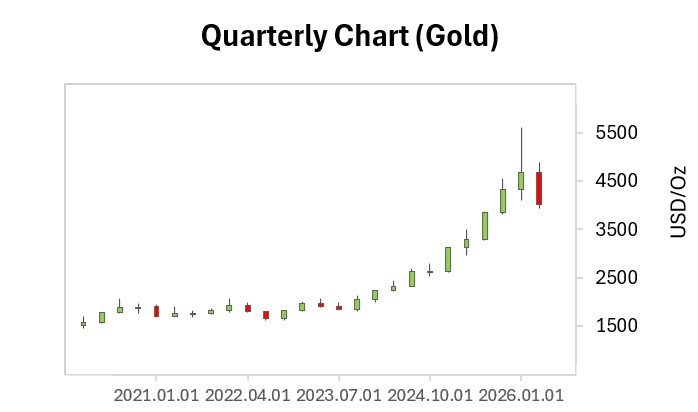
Gold enters Q3 2026 facing its first true tactical test after an unprecedented multi-quarter vertical acceleration that saw prices temporarily breach historical milestones. Following a massive, uninterrupted breakout from its multi-year consolidation base, the market has finally experienced a long-awaited healthy pause.
The most recent quarterly candle shows the first notable red bar in several quarters, indicating a fierce tug-of-war where bears aggressively locked in profits at the highs while long-term bulls stepped in heavily at structural support. This healthy correction represents a necessary transition from an unsustainable “speculative sprint” into a more sustainable, institutional-driven “marathon” pace.
From a structural perspective, our primary quarterly trend indicators suggest that the broader multi-year bull market remains entirely intact. While the short-term momentum has cooled off from its peak overextended territory, the long-term trend strength indicators continue to point upward with a healthy positive slope. This indicates that the current price softening is not a structural regime change or a market top, but rather a classic mid-cycle breathing room.
All in, we expect prices to face downward pressure and defensive consolidation throughout Q3 as short-term momentum gauges continue to reset from overextended peaks. Because the quarterly cyclical indicators have rolled down from overbought extremes, the market has successfully flushed out weak-handed speculative leverage.

This sets a much cleaner stage for the next wave of institutional accumulation, where deeper downside dips are expected to be aggressively bought into by long-horizon investors, keeping the dominant secular uptrend firmly in control.
Quarterly Risk Notes
While long-term trend indicators show the structural bull market is wounded but intact, short-term cyclical indicators have plunged into deeply depressed territories. If the nearest quarterly structural support fails to spark a convincing institutional bounce, it would signal that the market is transitioning from a temporary mid-cycle pause into a more prolonged macro consolidation.
Key Technical Levels
Support 1: ~$3,900 – $4,000 (nearest quarterly structural support)
Support 2: ~$3,550 – $3,600 (major prior consolidation area)
Resistance 1: ~$4,500 – $4,600 (psychological milestone / recent breakout zone)
Resistance 2: ~$5,300 – $5,500 (macro extension / next probable target region)
Macro Catalyst Themes for Q3 2026
- Real Yield Opportunity Costs: Re-emergence of gold’s inverse relationship with US real yields as the Fed maintains a higher-for-longer policy trajectory.
- Shifting Rate Expectations: Volatility driven by changing expectations surrounding global central bank rate cycles and liquidity expansion.
- US Dollar Index (DXY) Resilience: A strong greenback challenging gold’s status as a safe-haven alternative.
- Central Bank Buying Elasticity: Continued, yet structurally cooled, institutional accumulation compared to the historic rush of recent years.
- Sovereign Debt Risks: Looming global deficits and long-term fiscal expansion providing a persistent structural floor for the macro super-cycle.
—————————————————
Quarter 2 Outlook for Silver (XAG/USD)
Bears Grip the Near-Term Momentum as Silver’s Historic Spike Cools
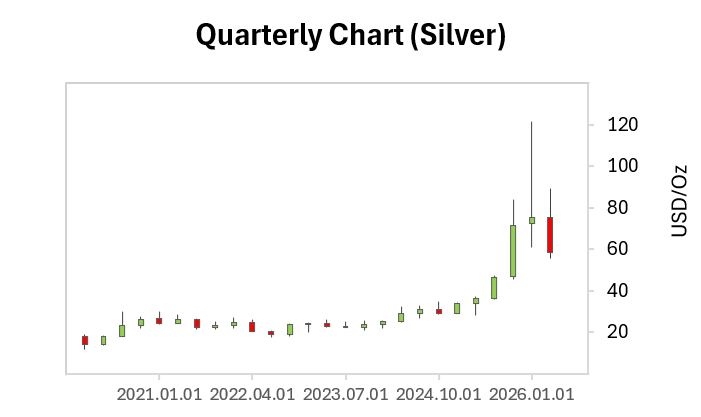
Silver enters Q3 2026 during a sharp, high-velocity correction after an unprecedented vertical surge that saw prices temporarily rocket to historic vertical milestones above $120. Following a multi-year slumber, the industrial precious metal experienced an explosive breakout that has finally run into a wall of aggressive profit-taking. The most recent quarterly candle is a decisive red bar, signalling that the bears have seized control of the immediate playing field, pushing the price back down to earth as speculative foam is violently flushed from the market.
From a technical standpoint, our primary quarterly trend indicators reveal a fascinating divergence between long-term strength and short-term exhaustion. While near-term cyclical indicators are plunging sharply downward, showing that selling momentum remains completely dominant for now, our long-term trend strength indicators continue to rise with a steep positive slope. This indicates that the overarching, multi-year secular bull market has not suffered a structural regime change; rather, the market is undergoing a brutal but necessary cooling-off phase to digest its massive overextension.

All in, we expect silver to remain in a decisive downward correction this quarter. Because short-term momentum gauges are still falling, the market has not yet confirmed a definitive technical floor, meaning further chop and downside testing could persist in the weeks ahead. However, because the structural core of the trend remains intact, these deep pullbacks are gradually moving silver back into areas of strong long-term value, where institutional accumulation is expected to step in to defend the broader macro advance.
Quarterly Risk Notes
The primary risk for Q3 2026 is a deeper-than-expected washouts driven by cascading speculative liquidations. Because silver is highly volatile, the sharp downturn in short-term cyclical gauges can cause prices to overcorrect on the downside even while the long-term trend remains healthy. A true structural breakdown would require a total collapse of our macro trend-strength indicators below historical baseline levels, but near-term volatility will remain elevated until the current selling velocity exhausts itself.
Key Technical Levels
Support 1: ~$55 – $60 (nearest quarterly structural support)
Support 2: ~$35 – $40 (major prior consolidation area and ultimate macro safety net)
Resistance 1: ~$80 – $90 (psychological milestone / immediate overhead supply zone)
Resistance 2: ~$110 – $120 (macro extension / previous historical peak region)
Catalyst Events to Watch:
- Real Yield Opportunity Costs: Re-emergence of silver’s inverse relationship with US real yields as the Fed maintains a higher-for-longer policy trajectory.
- Shifting Rate Expectations: Volatility driven by changing expectations surrounding global central bank rate cycles and liquidity expansion.
- US Dollar Index (DXY) Resilience: A strong greenback challenging silver’s safe-haven appeal and putting pressure on dollar-denominated commodities.
- Industrial Demand Volatility: Shifting global manufacturing data, electronics manufacturing, and solar sector growth metrics acting as a heavy swing factor for silver’s industrial side.
—————————————————
Quarterly Outlook (Q3 2026) for Platinum (XPT/USD)
A Gritty Momentum Reset Test as Platinum Digests Its Historic Spike
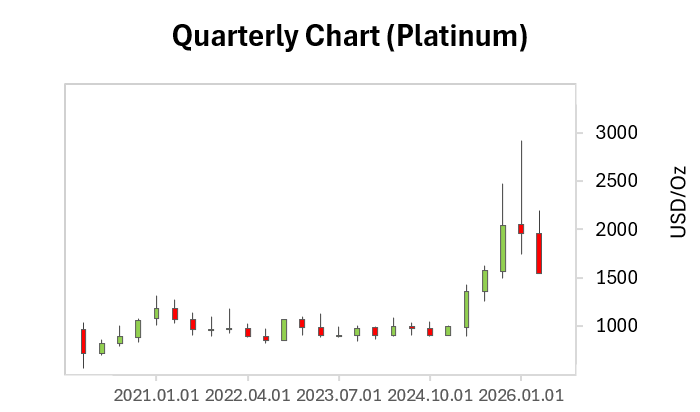
Platinum enters Q3 2026 undergoing a sharp, high-volatility correction after an unprecedented multi-quarter vertical acceleration that saw prices violently breach multi-year ceilings to strike historic highs near $3,000. Following a decade of structural stagnation, the market experienced an extraordinary breakout that has finally triggered a wave of aggressive profit-taking. The most recent quarterly candle shows a prominent red corrective bar, indicating that the bears have successfully wrestled back near-term control.
From a structural standpoint, the underlying price layout reveals a stark divergence between immediate selling pressure and the macro trend. While near-term cyclical indicators are pointing sharply downward, confirming that downward momentum remains fully dominant for the time being, the long-term trend strength indicators continue to head higher with an aggressive positive slope.
This indicates that the broader, macro secular breakout remains structurally valid; the market is simply experiencing a violent but technically healthy cooling-off phase required to work off deeply overextended conditions.
All in, we anticipate a clear downward reset for platinum in Q3 2026. Because short-term momentum gauges are still cascading downward, the market has yet to establish a definitive technical bottom, implying that choppy consolidation and further downside testing could easily carry over into the coming quarter.

However, as the structural uptrend remains intact, this steep retracement is rapidly bringing platinum back toward major historical support layers, where long-horizon institutional demand is expected to emerge to stabilize the broader bull cycle.
Quarterly Risk Notes
The primary risk heading into Q3 2026 centers on localized liquidation as stop-losses trigger within platinum’s characteristically thin liquidity conditions. Because short-term cyclical gauges have rolled over aggressively from historical extremes, prices can easily overcorrect despite a healthy secular backdrop. While a true structural trend reversal would require long-term trend strength to flatten or cross back down, immediate price swings will remain highly erratic until the ongoing selling velocity exhausts itself.
Key Technical Levels
Support 1: ~$1,500 – $1,600 (nearest quarterly structural support)
Support 2: ~$1,100 – $1,200 (ultimate macro safety net)
Resistance 1: ~$2,100 – $2,200 (psychological milestone)
Resistance 2: ~$2,700 – $2,900 (macro extension / previous historical peak region)
Catalyst Events to Watch:
- Automotive and Industrial Demand Revisions: Shifting global manufacturing trends, particularly changes in hydrogen technology infrastructure and automotive catalyst demand, acting as a crucial fundamental swing factor.
- Real Yield Opportunity Costs: Re-emergence of platinum’s inverse relationship with US real yields as the Federal Reserve maintains a higher-for-longer monetary policy trajectory.
- Supply-Side Disruptions and Mine Economics: Operational and power-grid constraints within primary mining jurisdictions (such as South Africa) providing a structural supply floor beneath the market.
—————————————————
For more Bullion Insights, join GoldSilver Central’s Telegram channel or subscribe to our Bullion Insights Newsletter.