Q: Do I still need an appointment?
A: We highly recommend booking online in advance to guarantee your slot. Walk-ins are welcome but are subject to daily capacity and are served on a “best effort” basis after all scheduled appointments.
Q: How does the walk-in QR system work?
Simply scan the QR code at our entrance. Enter the nature of your visit (Buy/Sell/Collect). You will receive a digital ticket and can monitor your position in the queue live on your phone.
Q: Can I leave the area while waiting?
A: Yes! That is the benefit of the virtual queue. You can shop or grab a coffee nearby. Just keep an eye on your live status page. We recommend heading back to the store when there are 2-3 people ahead of you.
Q: Will the queue number be called in sequence?
A: No, the queue number may not be called in sequence.
Q: What time do you stop issuing walk-in tickets?
A: To ensure we serve everyone currently in the queue before we close, we stop issuing new tickets at 4:00 PM on Weekdays and 11:00 AM on Weekends.
Q: What happens if the store closes before my number is called?
A: During periods of extreme demand, a ticket does not guarantee service. If we reach closing time (5:45 PM Weekdays / 1:00 PM Weekends) and cannot fulfill your request, you will unfortunately need to return another day. We recommend arriving early.
Q: I had an online appointment but I’m running late. What should I do?
A: Online appointments are prioritized. However, if you are more than 15 minutes late, your priority status may be forfeited, and you may be asked to join the walk-in queue.
Q: I missed my Q-number notification! Can I still be served?
A: If your number is called and you are not present, the system will move to the next person. To be fair to others waiting, you will need to scan the QR code and take a new number.
⚖️ Store Visit Policy
To maintain a safe, respectful, and orderly environment for both our clients and our team:
Service Capacity: GoldSilver Central reserves the right to stop issuing queue numbers earlier than 4 PM if the volume of customers exceeds our operational capacity for the day.
Final Authority: In the case of any dispute regarding the queue system, ticket issuance, or store entry, GoldSilver Central reserves all rights. All decisions made by our management are final. We appreciate your cooperation and patience as we navigate these busy market conditions together.

Gold, Silver, Platinum Quarterly Insights: Q4 2025 Review & Q1 2026 Outlook
As we enter a new year of unprecedented market dynamics, investors are increasingly looking for stability and growth in the precious metals sector. At GoldSilver Central, we provide deep-dive analytics into the gold, silver, and platinum markets to help you stay ahead of the curve. Our Q4 2025 review and 2026 outlook highlight a historic “super-cycle” phase across all three major metals.
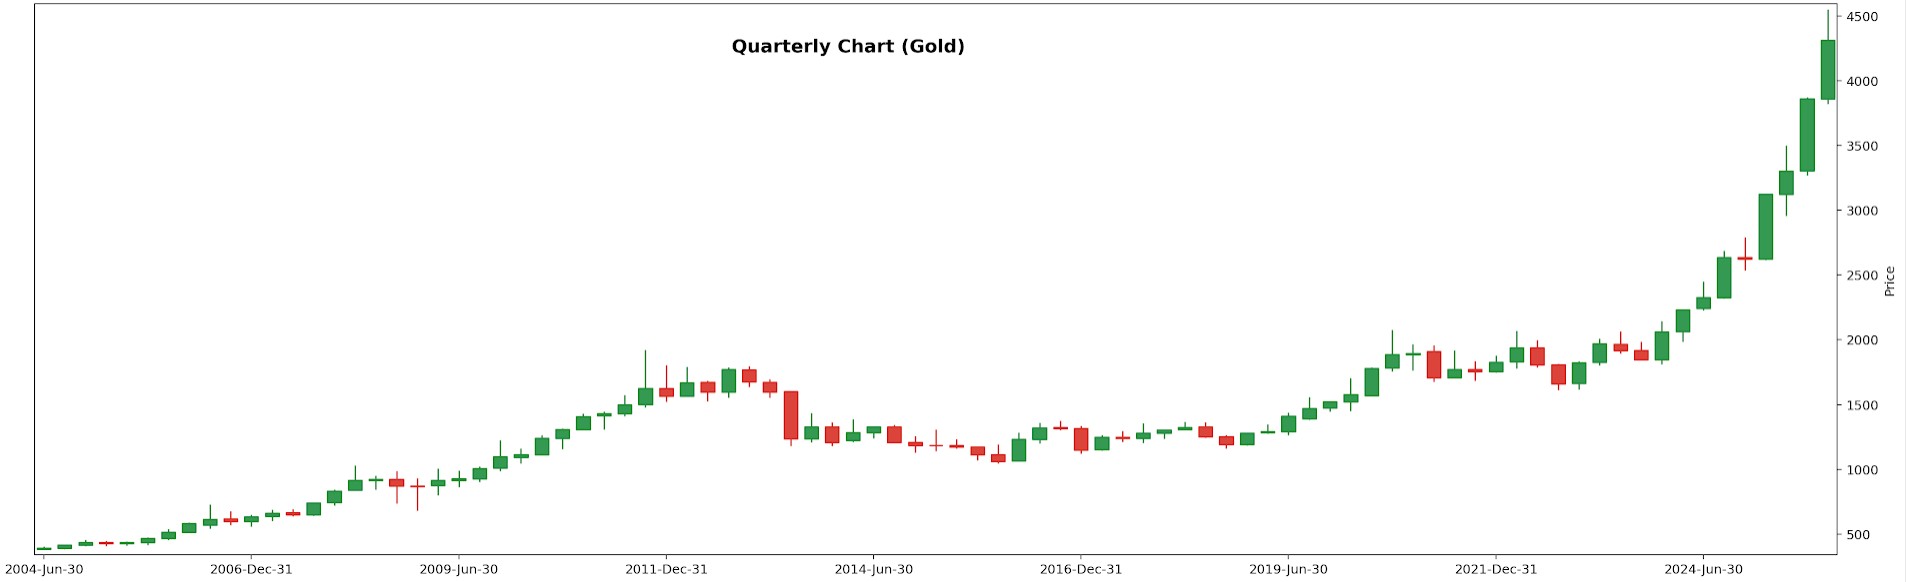
Quarterly Outlook: Q4 2025 (Quarter ending December 31, 2025) for Gold (XAU/USD)
Strongest multi-quarter bull phase since 2005–2011
Gold continues to exhibit one of the strongest long-term breakouts in its modern history, with quarterly candles accelerating vertically after clearing the multi-year consolidation zone around $2,050–$2,150 toward fresh all-time highs above $4,000–$4,300. Price is now in pure price-discovery mode above the prior multi-year highs.
The last several quarters have shown strong green candles, higher highs and higher lows, zero meaningful pullback on quarterly scale, with the most recent quarterly bar showing a decisive continuation impulse, reaffirming gold’s dominant secular uptrend that has been in place since 2018. This quarterly breakout is uniquely large and steep, suggesting a broad macro repricing of gold as a reserve asset, not a short-term speculative blowoff, alongside institutional accumulation and long-horizon trend conviction.
From our quarterly trend indicators, gold now mirrors early-stage 2009–2010 acceleration, but with a steeper slope, suggesting we are entering the middle phase of a major bull market, not the end. Consistent with strong long-term trend strength, our quarterly cyclical indicators are aligned in peak-trend configuration to support trend continuation, suggesting no near-term exhaustion on the quarterly timeframe.
All in, gold enters Q1 2026 with an exceptionally strong bullish bias with dips likely to be shallow and aggressively accumulated. The structure points toward an ongoing super-cycle phase driven by falling real yields, global liquidity rotation, and persistent geopolitical risk premiums. As long as gold remains above $3,900, the secular uptrend remains dominant with open-air upside toward $4,500–$5,000 in the coming quarters.
Quarterly Risk Notes For Gold
Quarterly charts rarely give early reversal signals — weakness would first appear in monthly, not quarterly. Only a sharp breakdown in our trend indicators or a collapse in our cyclical indicators would imply change in structural regime.
Key Technical Levels:
Support 1: ~$3,900 (nearest quarterly structural support)
Support 2: ~$3,550–$3,600 (major prior consolidation area)
Resistance 1: ~$4,500 (psychological milestone)
Resistance 2: ~$4,800–$5,000 (macro extension / next probable target region)
Macro Catalyst Themes for Q1 2026
• Real yields and Treasury market volatility
• Fed rate-cut cycle expectations and liquidity expansion
• USD index (DXY) direction
• Geopolitical risk (Middle East / Asia tensions)
• Central bank gold purchases (continued accumulation trend)
• Global recession risk — historically bullish for gold
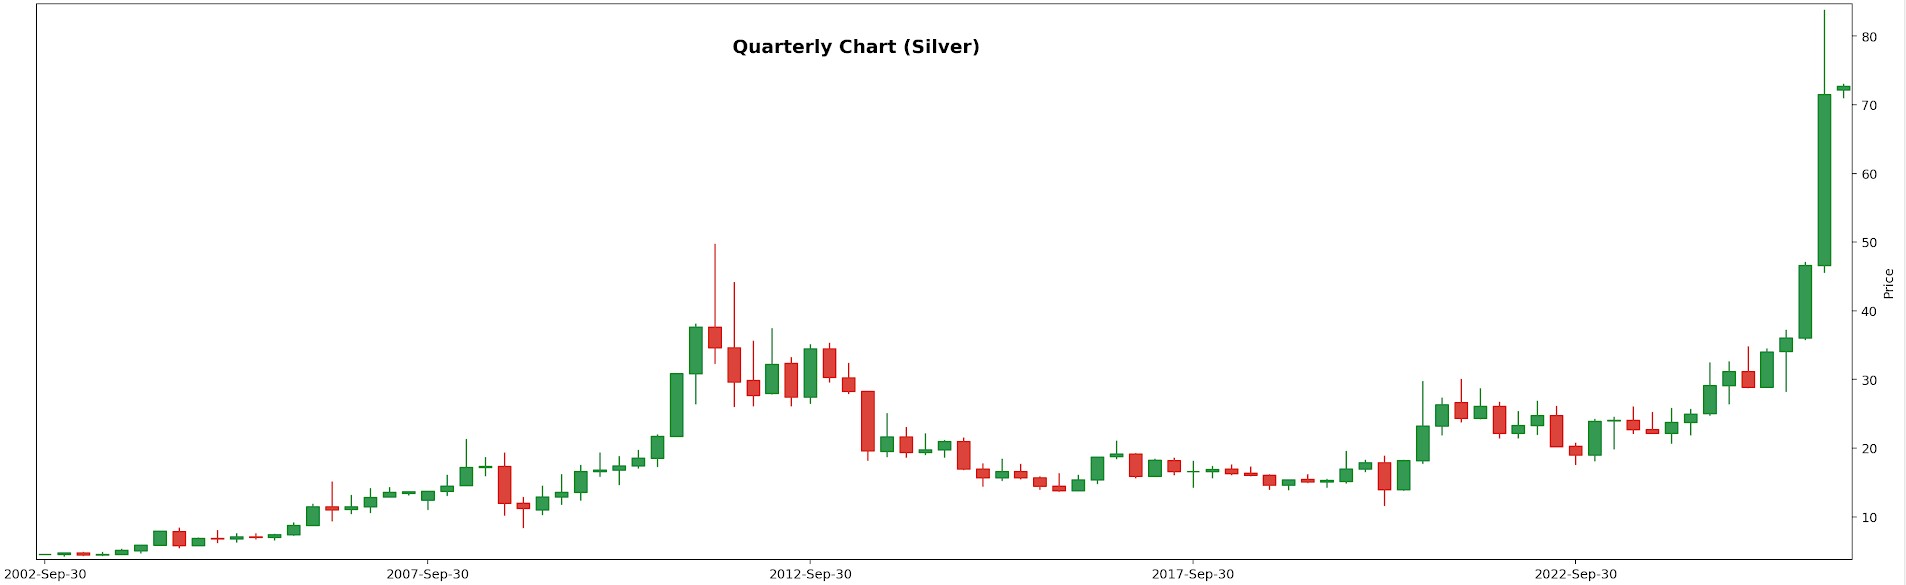
Quarterly Outlook: Q4 2025 (Quarter ending December 31, 2025) for Silver (XAG/USD):
A super-trend phase with open upside potential extending into 2026
Silver has entered a historic acceleration phase on the quarterly timeframe, breaking decisively above all prior multi-year resistance and surging into new all-time high territory. This quarter’s candle is a powerful bullish expansion bar, reflecting a structural regime shift from long-term consolidation into a full momentum breakout – one of its strongest quarterly breakouts in decades.
The breakout candle is large, directional, and supported by tight clustering of prior quarters — a textbook ignition pattern. The magnitude and velocity of the move clearly indicate institutional repositioning, macro flows favoring precious metals, and tightening physical market dynamics.
The quarterly structure now aligns with a parabolic continuation pattern, supported by synchronized breakouts in gold and platinum. The slope of the quarterly trend has steepened significantly, confirming acceleration rather than exhaustion. With strong confirmation across trend and cyclical indicators, silver appears to be in the early-to-mid stages of a large multi-quarter uptrend, signifying trend lock-in — a hallmark of super-cycles. No overhead resistance exists; price is in full price discovery mode.
As long as silver holds above $60, the bullish super-cycle structure remains firmly intact, with open upside into 2026 and potential psychological targets at $85–100, with volatility expanding but bias clearly upward.
Key Technical Levels For Silver:
Support 1: ~$60 (first major retest zone / breakout base)
Support 2: ~$50 (prior multi-year ceiling)
Resistance 1: None — price discovery
Resistance 2: N/A — higher targets develop as structure forms
Potential future resistance projections (if trend continues):
$85–90 (psychological round zone)
$100 (major psychological and historical projection target)
Note: Quarterly levels are wide due to large candle height
Macro Catalyst Themes for Q1 2026
(i) Structural Demand Drivers
Solar PV and green-energy expansion
Battery and electronics demand growth
Industrial restocking cycles
(ii) Macro & Monetary Drivers
Declining real yields
USD weakening episodes
Monetary easing cycles from central banks
Rising geopolitical hedging demand
(iii) Supply Factors
Persistent mine under-investment
Fragile Mexican and Peruvian output
Tightening above-ground stocks
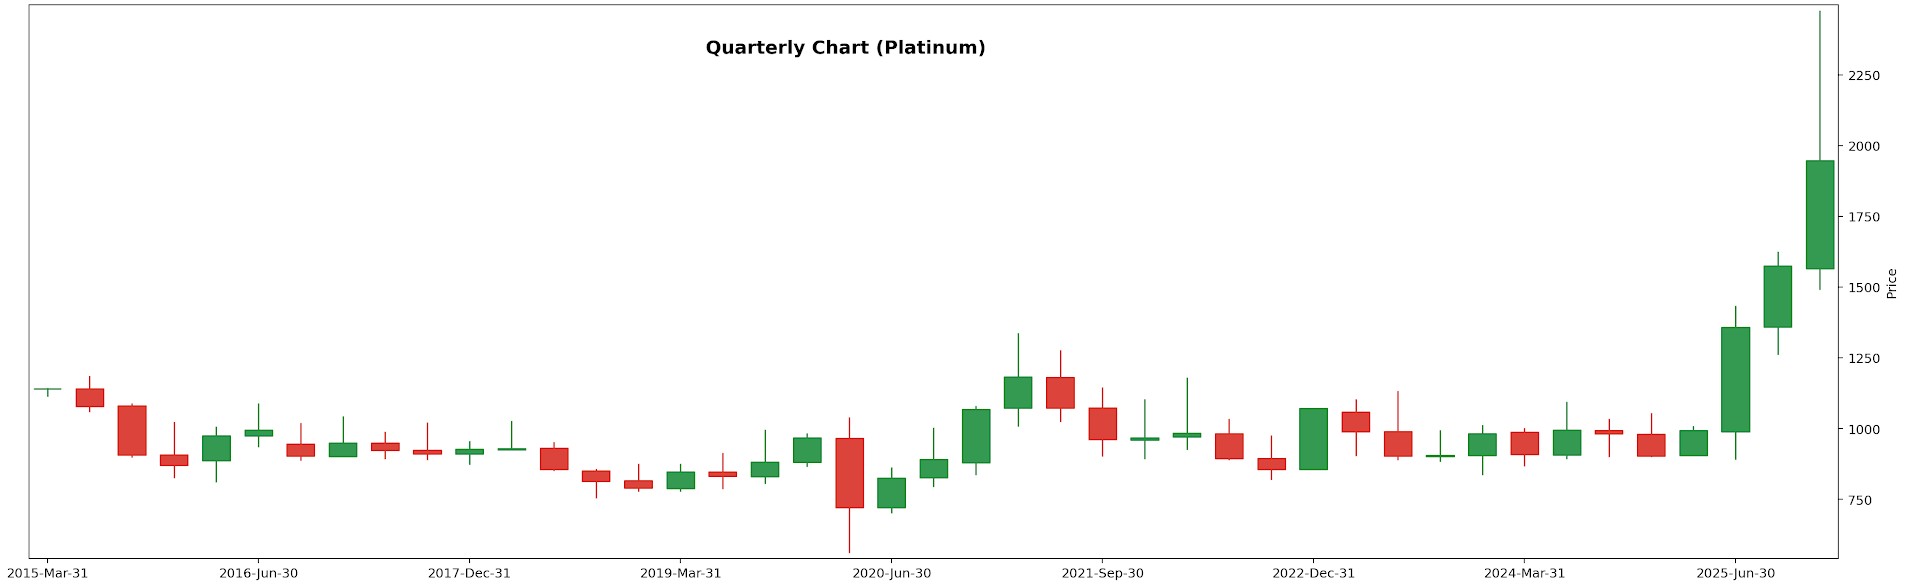
Quarterly Outlook: Q4 2025 (Quarter ending December 31, 2025) for Platinum (XPT/USD):
$1,700 Key Support
Platinum has confirmed a long-awaited quarterly breakout, transitioning from a multi-year accumulation range $1,100–$1,200 into a strong bullish expansion phase, accelerating sharply into the $1,900–$2,000+ region. The latest quarterly candle is a large bullish expansion bar, confirming a regime shift from prolonged range-bound behavior into a sustained trending phase.
This move represents the strongest quarterly upside impulse in platinum in more than a decade. Price has entered a higher structural regime, and is now entering price-discovery territory, with limited historical overhead supply.
Our trend indicators showcase strengthening trend energy rather than maturity. This is characteristic of early-to-mid trend development, not a terminal move. Meanwhile, quarterly cyclical behavior mirrors the early breakout phases seen in prior commodity super-cycles rather than late-stage exhaustion. All in, indicators are supportive of further upside across coming quarters.
While volatility may expand as the trend develops, the quarterly structure favors continued upside into 2026 as long as platinum holds above $1,700. From a cycle perspective, platinum appears to be earlier in its trend than gold and silver, suggesting relative upside potential over the coming quarters if industrial demand, auto-catalyst usage, and supply constraints remain supportive.
Key Technical Levels For Platinum:
Support 1: ~$1,700 (first major breakout retest zone)
Support 2: ~$1,400–$1,500 (upper boundary of prior base)
Resistance 1: ~$2,300 (measured breakout extension)
Resistance 2: ~$2,600–$2,800 (long-term projection zone if trend persists)
Macro Catalyst Themes for Q1 2026
Auto-sector demand recovery and emissions-standard tightening
Hydrogen and fuel-cell investment trends
South African mining supply stability (key structural risk)
Precious-metals portfolio rotation alongside gold and silver
Macro liquidity cycles and real-yield dynamics
Contact GoldSilver Central via email ([email protected]) or WhatsApp (+65 8893 9255) to receive actionable analysis on gold, silver, and platinum that empowers your trading decisions. Let us help you navigate the complexities of trending and cyclical markets with confidence.
Precious metal prices, like Gold, Silver, and Platinum, often oscillate between trending and cyclical phases, creating distinct opportunities and challenges for traders. Understanding these dynamics is crucial for aligning your strategy with the prevailing market environment. Here’s an in-depth look at how these phases operate and how traders can use them to their advantage.
Trending Phases
In trending phases, precious metal prices move in a clear and sustained direction—upward in bullish trends or downward in bearish trends. These movements are influenced by economic details, including:
- Interest Rates: Changes in central bank policies, such as rate hikes or cuts, directly impact precious metals, which are non-yielding assets.
- Macroeconomic Data: Inflation reports, employment data and GDP growth often set the tone for the metals market.
- Geopolitical Events: Global uncertainty, like wars or trade disputes, tends to favor safe-haven assets like gold.
While economic factors influence market sentiment, price movement ultimately depends on the underlying buying or selling action. These phases vary in sustainability and depending on the horizon of the trade, different metrics should be used to derive the outlook.
Cyclical Phases
Cyclical, or range-bound, phases occur when precious metal prices fluctuate between well-defined support and resistance levels. These phases often suggest a balance between buyers and sellers, leading to indecision in the market. Key characteristics of cyclical markets include:
- Repetitive Movements: Prices oscillate within a specific range, often without a clear direction.
- Market Consolidation: These periods are often precursors to a breakout in either direction.
- Neutral Bias: There is no strong preference for upward or downward movements, making directional strategies less effective.
Trading a trending strategy in a cyclical market can lead to losses, as the lack of directional momentum results in false signals. Instead, range-bound strategies are better suited for these phases.
Insights from the GSC Morning Call
At GSC Morning Call, we provide daily insights to help traders navigate these phases effectively. Our analysis includes:
- Identifying Market Phases: Determine whether the day’s price action is likely to be trending or cyclical.
- Defining Bias: Highlight the underlying bias within each phase to guide trading strategies.
- Support and Resistance Levels: Offer indicative levels for planning entries and exits, minimizing risk.
By combining these insights with broader trend analysis, traders can position themselves to capitalize on opportunities while mitigating risks.
Want to know more?
Contact us via email ([email protected]) or WhatsApp (+65 6222 9703) to receive actionable analysis that empowers your trading decisions. Let us help you navigate the complexities of trending and cyclical markets with confidence.
Preview of full Precious Metals Bullion Insights Report
To receive the full report of our Precious Metals Bullion Insights on a weekly basis, please subscribe here:
(We promise there will be no spam but informative insights from our in-house technical analyst team!)
PRECIOUS METALS MARKET REVIEW.
| Weekly Spot Price (30 April – 4 May 2018) | ||||
| Open | High | Low | Close | |
| Gold | 1322.47 | 1325.40 | 1301.37 | 1312.91 |
| Silver | 16.50 | 16.58 | 16.04 | 16.46 |
| Platinum | 911.45 | 919.18 | 908.27 | 914.19 |
Precious Metals News Updates:
| · | Exclusive: World’s biggest gold ETF launching new low-fee fund –source The World Gold Council, owner of the world’s largest gold-backed exchange traded fund (ETF), is launching a new fund with a cut-price management fee to fend off rivals with lower charges, a source familiar with the matter told Reuters. |
| · | · Lebanon Central Bank Governor on Elections, Reforms, Gold Lebanon Central Bank Governor Riad Salame discusses the Lebanese elections, structural reforms, financial engineering, protection of the peg and his outlook for gold. |
| · | Inflation Trade: Gold Lags, Silver Leads As Expected If an inflationary phase took root last week, the expected happened as silver took over leadership from gold. However, the trend in Silver/Gold is still down and until that changes some caution about an inflationary party atmosphere is warranted. |
| · | LAWRIE WILLIAMS: Chinese gold demand way up in April Indeed April 2018 gold withdrawals were comfortably higher than those in April 2015 too, but in the latter year gold withdrawals out of the SGE were particularly strong in the second half of the year and totalled almost 2,600 tonnes for the full year – around 80% of total global new mined production. |
Economic figures to monitor this week:
| Day & Date | Economic Events | |
| Monday, 7/5/2018 | Retail Sales (MoM) (Mar) (AU) | |
| Tuesday, 8/5/2018 | Fed Chair Powell Speaks (US)
JOLTs Job Openings (US) |
|
| Wednesday, 9/5/2018 | PPI (MoM) (Apr) (US)
Crude Oil Inventories (US) |
|
| Thursday, 10/5/2018 | Manufacturing Production (MoM) (UK)
BoE Inflation Report (UK) BoE Interest Rate Decision (May) (UK) Core CPI (MoM) (Apr) |
|
| Friday, 11/5/2018 | ECB President Draghi Speaks (EUR) |
TECHNICAL ANALYSIS.
| Current Market mode*: Cyclical (as defined by daily ADX) | ||
| Weekly Short Term Outlook: Downward Bias (as defined by weekly CCI Indicators) | ||
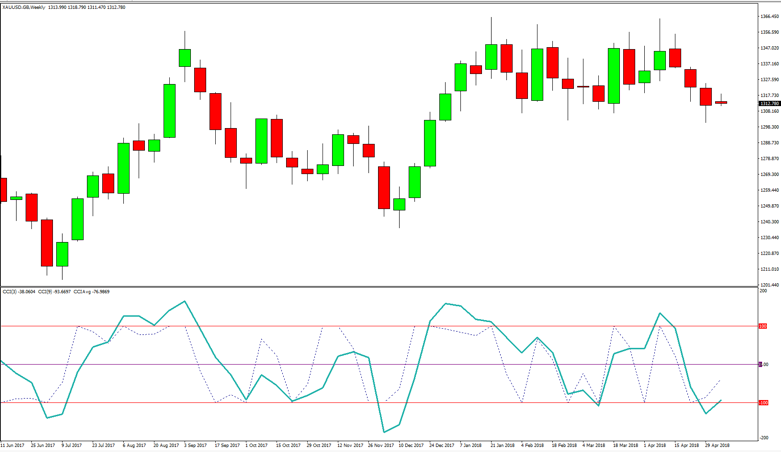 |
Short term cyclical indicators show a downward bias for the week as CCI (3) and (9) are hovering below the -100 level. | |
| Long term trend: Up (as defined by yearly Moving Averages) | ||
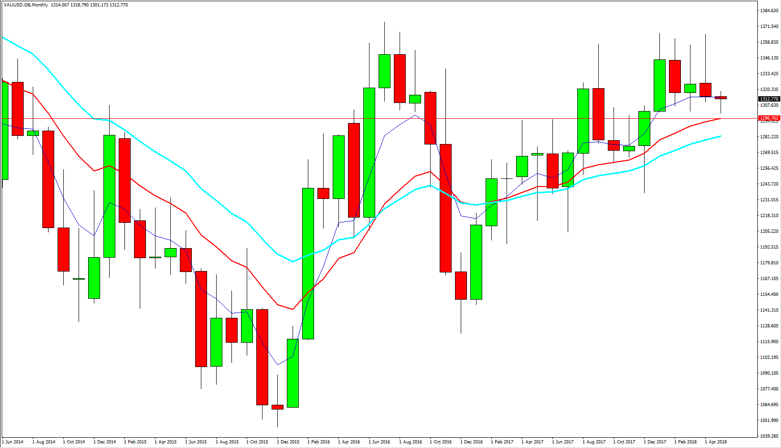 |
The nearest support level is now at USD1297 (13 period EMA) as gold prices continue to rise. | |
| NOTE: | In Non Trending Mode markets (aka range trading markets), CCI directional Indicators have statistically demonstrated a higher correlation to market direction. Additionally, we overlay the CCIs in a format that further reveals market cyclical structure and thus enhances market analysis. | |
COMMITMENT OF TRADERS REPORT (ANALYSIS)
Reportable positions as of 01 May 2018,
| Commitment of Traders Report | |||||||||
| Commercial | Non Commercial | ||||||||
| Producer/Merchant
/Processor/User |
Swap Dealers | Managed
Money |
Other
Reportables |
Non
Reportable Positions |
|||||
| Long | Short | Long | Short | Long | Short | Long | Short | Long | Short |
| 54,547 | 201,900 | 124,542 | 107,539 | 128,474 | 76,489 | 74,827 | 23,444 | 58,266 | 31,283 |
| Changes in commitments from 24 April 2018, | |||||||||
| -1,755 | -16,211 | 574 | -22,427 | -29,503 | 32,875 | 3,609 | -20,223 | 2,596 | 1,507 |
OUR TAKE:
Commercials increase their long positions by 54,547 contracts during the period of 24 April 2018 to 1 May 2018, while also increasing their short positions by 201,900 contracts during the same period.
(Focus is only on the Producer/Merchant/Processor/User as they are hedgers and Gold producers. Non-Commercials refer to CTAs and fund managers who trade (speculate) professionally. Commercial hedgers usually hold an edge over the speculators in the long run due to their “stronger hand” advantage and are usually reliable indicators of trend changes)
Call us at 6222 9703 or email at [email protected] to discuss with us how to further interpret the data.
Preview of full Precious Metals Bullion Insights Report
To receive the full report of our Precious Metals Bullion Insights on the first working day of each week, please subscribe here:
(We promise there will be no spam but informative insights from our in-house technical analyst team!)
[gravityform id=”3″ title=”true” description=”true”]
PRECIOUS METALS MARKET REVIEW.

| Weekly Spot Price (14 August – 18 August 2017) | ||||
| Open | High | Low | Close | |
| Gold | 1289.85 | 1300.61 | 1267.06 | 1284.1 |
| Silver | 17.07 | 17.27 | 16.53 | 16.93 |
| Platinum | 984.08 | 987.81 | 950.43 | 976.58 |
Precious Metals News Updates:
| · | Gold trades little changed as investors focus on geopolitics, central bank meet. Gold prices were little changed on Monday as investors sought further direction after a week of geopolitical uncertainty in the United States and Europe and ahead of a meeting of central bankers later this week. | ||
| · | All that glitters is profit in China’s gold mines as demand for safe haven boost precious metal sales. Hedging demand triggered by political uncertainty became the main driver of the periodical increases in gold price. | ||
Economic figures to monitor this week:
| Day & Date | Economic Events |
| Wednesday, 23 August 2017 | ECB President Draghi Speaks
New Home Sales (Jul) (US) Crude Oil Inventories |
| Thursday, 24 August 2017 | GDP (QoQ) (Q2) (UK)
Existing Home Sales (Jul) (US) |
| Friday, 25 August 2017 | Core Durable Goods Orders (MoM) (Jul) (US)
Fed Chair Yellen Speaks |
TECHNICAL ANALYSIS.
| Current Market mode*: Trending Up (as defined by daily ADX) | |||
| Weekly Short Term Outlook: Up (as defined by weekly CCI Indicators) | |||
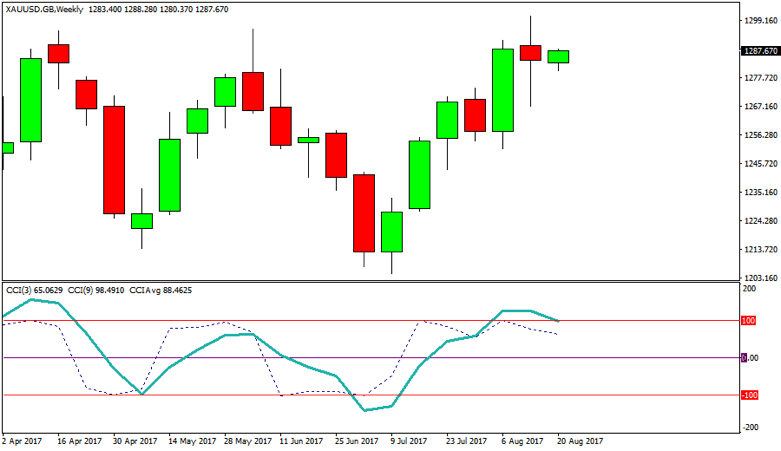 |
Short term cyclical indicators show an upward bias for the week as CCI (3) and CCI (9) continues to hover around the 100 level. | ||
| Long term trend: Up (as defined by yearly Moving Averages) | |||
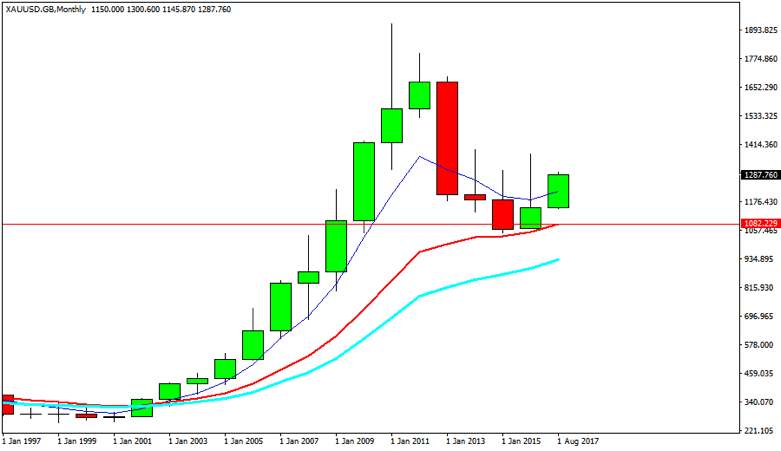 |
The nearest support level is now at USD1082 (13 period EMA) as gold prices continue to rise. | ||
NOTE:
In Non-Trending Mode markets (aka range trading markets), CCI directional Indicators have statistically demonstrated a higher correlation to market direction. Additionally, we overlay the CCIs in a format that further reveals the market cyclical structure and thus enhances market analysis.
COMMITMENT OF TRADERS REPORT (ANALYSIS)
Reportable positions as of 15/8/2017,
| Commitment of Traders Report | |||||||||
| Commercial | Non Commercial | ||||||||
|
Producer/Merchant /Processor/User |
Swap Dealers | Managed
Money |
Other
Reportables |
Non Reportable Positions |
|||||
| Long | Short | Long | Short | Long | Short | Long | Short | Long | Short |
| 32,943 | 191,174 | 71,922 | 114,046 | 196,453 | 16,916 | 80,313 | 68,019 | 44,294 | 35,769 |
| Changes in commitments from 8/8/2017 | |||||||||
| -424 | +13,652 | -2,380 | +23,283 | +29,385 | -11,586 | +3,188 | +2,170 | -23 | +2,227 |
OUR TAKE:
Commercials continued to decrease their long positions while increasing their shorts positions by -424 contracts and 13,652 contracts respectively during the period of 8/8/2017 to 15/8/2017. Gold rallied 2% to reach the 1290 level, a level last seen in June. This is the first time in 4 weeks that Commercials increased their shorts position significantly. The last time this happened, Gold rallied as well.
(Focus is only on the Producer/Merchant/Processor/User as they are hedgers and Gold producers. Non Commercials refer to CTAs and fund managers who trade (speculate) professionally. Commercial hedgers usually hold an edge over the speculators in the long run due to their “stronger hand” advantage and are usually reliable indicators of trend changes)
Call us at 6222 9703 or email at [email protected] to discuss with us how to further interpret the data.
PRECIOUS METALS MARKET REVIEW.
| Weekly Spot Price (19 June – 23 June 2017) | ||||
| Open | High | Low | Close | |
| Gold | 1253.62 | 1258.69 | 1240.65 | 1255.47 |
| Silver | 16.63 | 16.75 | 16.31 | 16.59 |
| Platinum | 926.15 | 933.83 | 915.9 | 926.43 |
| · | Gold Prices Weekly Forecast: Narrow Ranges Likely, Selling Interest On Rallies. Several US economic data release this week may suggest a decisive impact on sentiments surrounding the US economy, the Federal Reserve policy and Gold Prices. | ||
| · | Gold Plunges After 1.8 Million Ounces Were Traded in One Minute. Bullion sank at 9 a.m. in London on Monday after a huge spike in volume in New York futures that traders said may have been the result of a “fat finger,” or erroneous order. Trading jumped to 1.8 million ounces of gold in just a minute, an amount that’s bigger than the gold reserves of Finland. | ||
| · | Gold Miners (GDX) Setting Up For A Big Move Soon. Gold and especially gold mining stocks rebounded on Wednesday and trended higher into the weekend. This is giving some investors renewed hopes that the bull market that began roughly 18 months ago is about to reassert itself. | ||
| · | Economic figures to monitor this week: | ||
| Day & Date | Economic Events | ||
| Tuesday, 27 June 2017 | BoE Financial Stability Report (UK)
CB Consumer Confidence (Jun) |
||
| Wednesday, 28 June 2017 | Fed Chair Yellen Speaks (US)
Pending Home Sales (MoM) (May) (US) Crude Oil Inventories (US) |
||
| Thursday, 29 June 2017 | GDP (QoQ) (Q1) (US) | ||
| Friday, 30 June 2017 | Manufacturing PMI (Jun) (CHN)
GDP (QoQ) (Q1) (UK) |
||
Interested in our full free weekly Technical Analysis Report for Precious Metals?
Sign up here:
[gravityform id=”3″ title=”true” description=”true”]
PRECIOUS METALS MARKET REVIEW.
| Weekly Spot Price (5 June – 9 June 2017) | ||||
| Open | High | Low | Close | |
| Gold | 1279.66 | 1295.9 | 1264.38 | 1265.55 |
| Silver | 17.5 | 17.7 | 17.11 | 17.11 |
| Platinum | 952.84 | 967.18 | 933.86 | 935.5 |
Precious metals updates…
| · | Gold edges up on weaker stocks, dollar ahead of Fed meeting. Gold inched up on Monday as Asian stocks fell and the dollar eased ahead of a U.S. Federal Reserve policy meeting that could give clues on the pace of interest rate hikes over the rest of the year. | ||
| · | SHARPS PIXLEY Sees A 252 pct Increase In Physical Gold Demand. The elections leading to a hung parliament in the UK have seen a rush into physical gold by investors, as the country slips into a political vacuum. The uncertainty both in the UK and indeed geopolitical concerns across the globe have fed into firmer gold prices which have risen 11 pct so far in 2017 in international markets. | ||
| · | Economic figures to monitor this week: | ||
| Day & Date | Economic Events | ||
| Tuesday, 13 June 2017 | CPI (YoY) (May) (UK) PPI (MoM) (May) (US) |
||
| Wednesday, 14 June 2017 | Industrial Production (YoY) (May) (CHN) Claimant Count Change (May) (UK) Core CPI (MoM) (May) (US) Core Retail Sales (MoM) (May) (US) Crude Oil Inventories (US) |
||
| Thursday, 15 June 2017 | Fed Interest Rate Decision (US) BoE Interest Rate Decision (Jun) (UK) |
||
| Friday, 16 June 2017 | BoJ Monetary Policy Statement (YoY) (JPN) BoJ Interest Rate Decision (JPN) CPI (YoY) (May) (EUR) Building Permits (May) (US) |
||
Interested in our full free weekly Technical Analysis Report for Precious Metals?
Sign up here:
[gravityform id=”3″ title=”true” description=”true”]

Hi customers! We would just like to highlight a very important point for all physical Gold, Silver and Platinum investors. Recently there were cases of counterfeit/fake gold bars in Singapore, and we came across this article which featured a “Real 24K Gold Plated CREDIT SUISSE Layered Bullion Gold Bar” for sale.
Here, for comparison, we have taken raw unedited photos of our Credit Suisse Gold Bar for your reference. Immediately, one can notice that the font type for the serial number is different between the 2 bars.
As always, please purchase your physical precious metals from an authorized distributor to avoid being a victim of fake metal deals.